
Fig. 3.
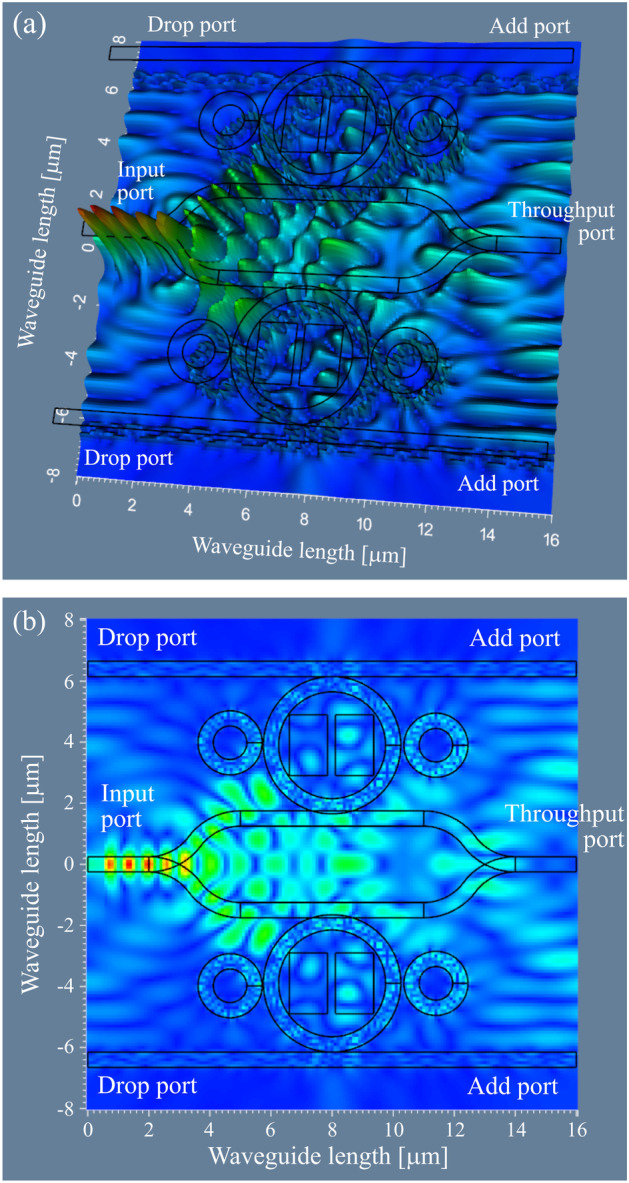
The Optiwave FDTD graphical results, where (a) the intensity plot of the WGM formed at the center of the microring, (b) the electric field distribution within the up and downlink nodes. The used parameters are listed in Table 1
Official websites use .gov
A
.gov website belongs to an official
government organization in the United States.
Secure .gov websites use HTTPS
A lock (
) or https:// means you've safely
connected to the .gov website. Share sensitive
information only on official, secure websites.
The Optiwave FDTD graphical results, where (a) the intensity plot of the WGM formed at the center of the microring, (b) the electric field distribution within the up and downlink nodes. The used parameters are listed in Table 1