
Fig. 8.
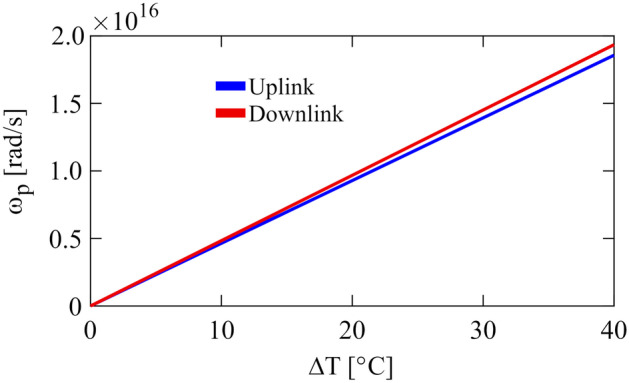
The plot of plasma frequency shift and temperature change, where the sensitivity of 0.04 rads−1 °C−1 and 0.05 rads−1 °C−1 is obtained, respectively, for the uplink and downlink sensor nodes. The temperature sensor is applied with the COVID-19 surveillance mode