
Fig. 6. Microvesicular steatosis in PITPα−/− hepatocytes.
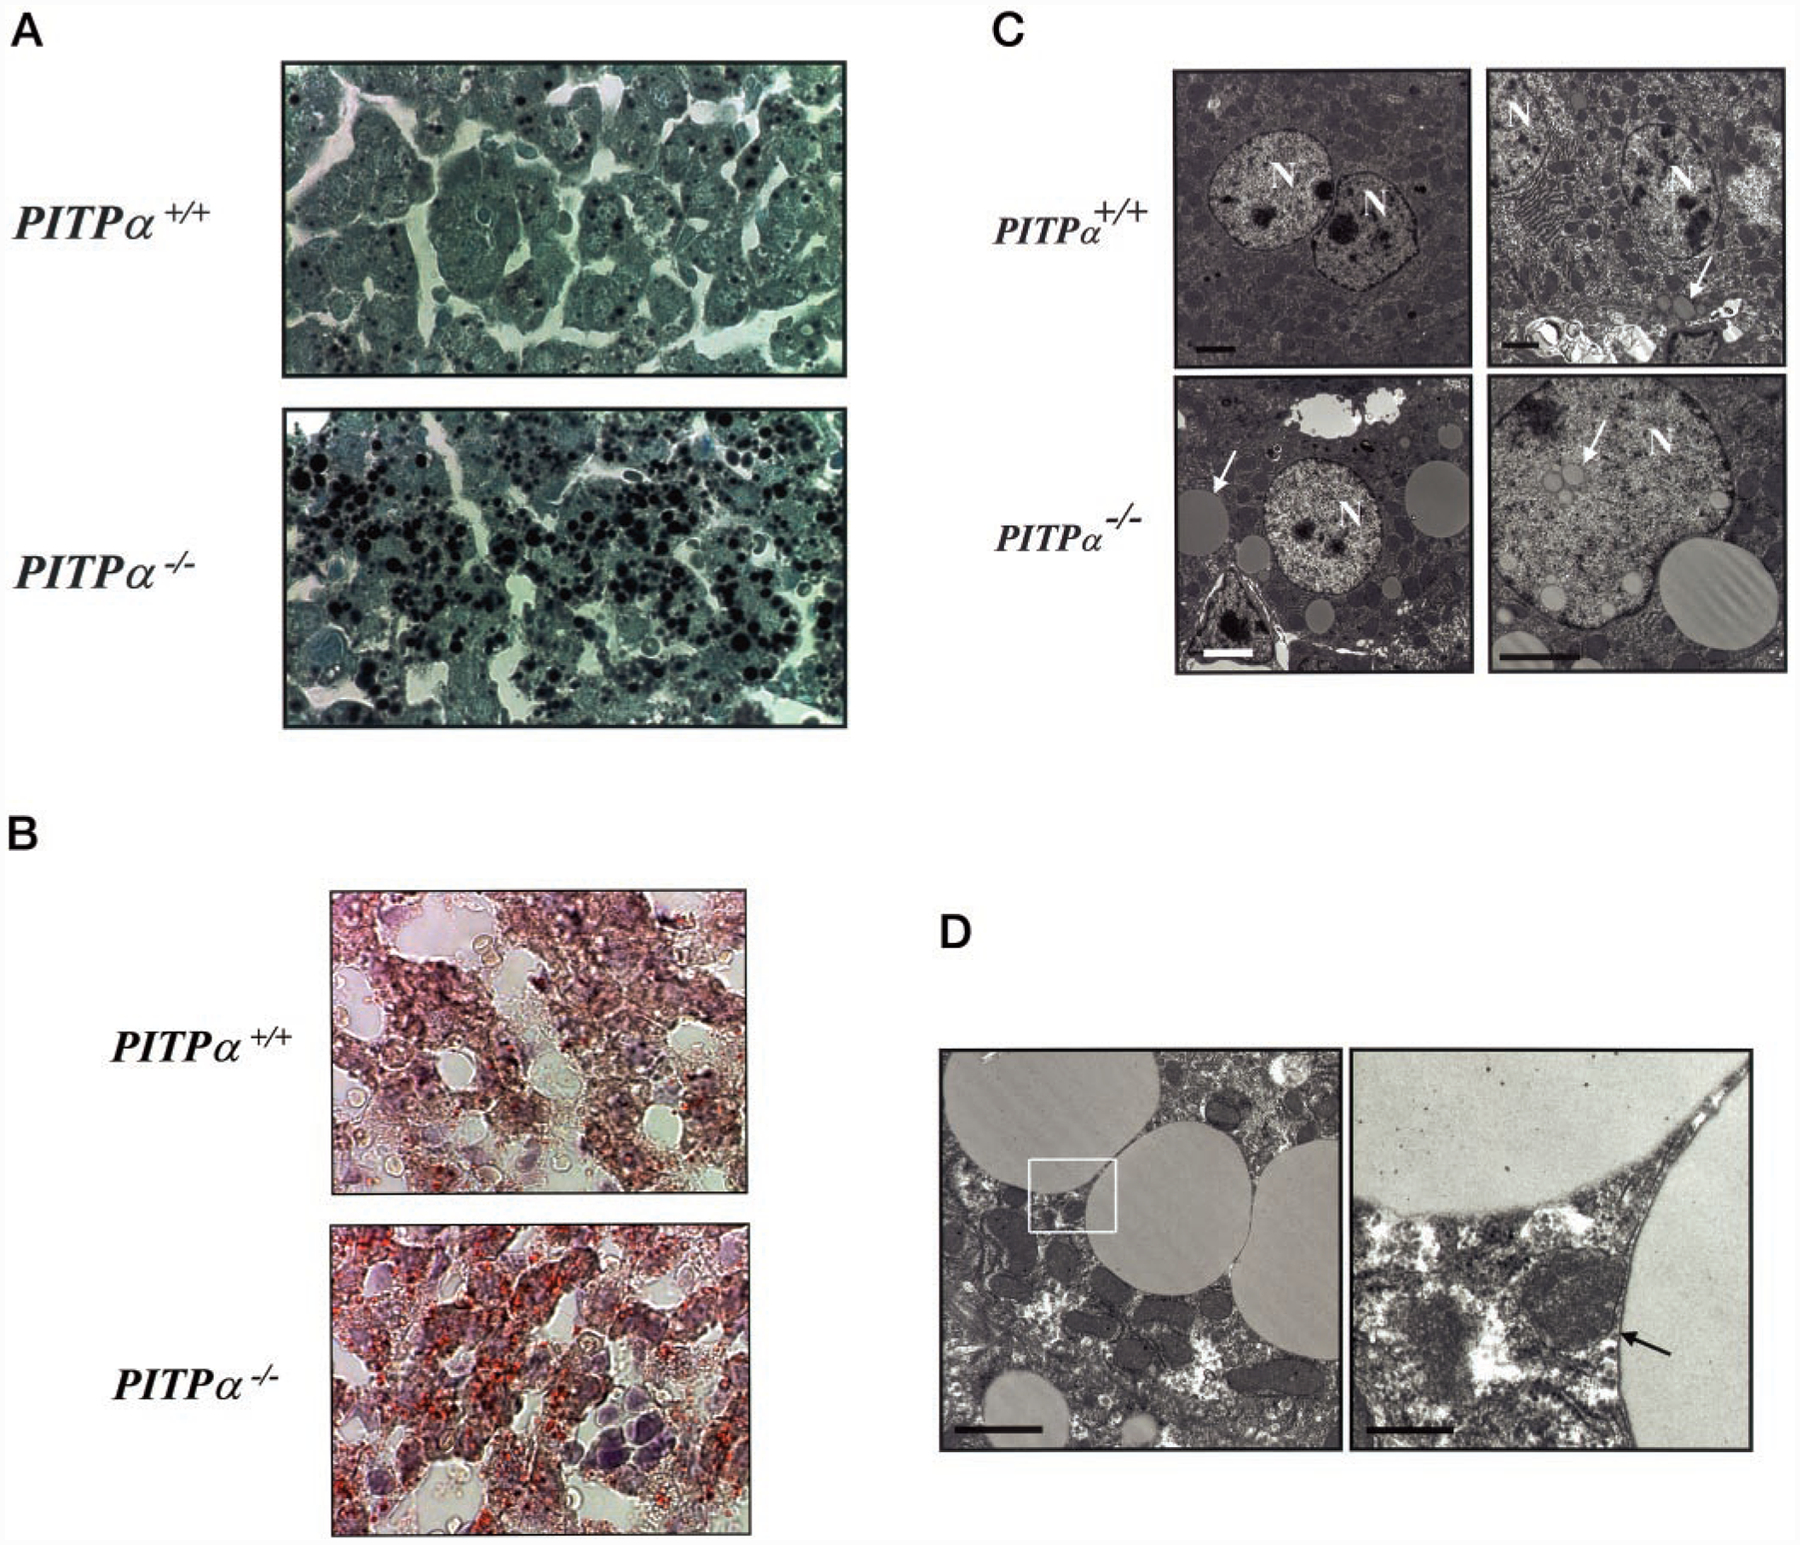
A, liver sections from PITPα+/+ and PITPα−/− P5 siblings were stained with osmium and counterstained with toluidine blue O. Black granules identify lipid. Relevant genotypes are given at left. B, liver sections from mice of the indicated genotype were stained with Oil Red O and counterstained with hematoxylin/eosin. The red globules prevalent in sections of PITPα nullizygous liver identify neutral lipid bodies. C, electron micrographs of PITPα+/+ and PITPα−/− liver sections are shown. Nuclei (N) and examples of lipid bodies are highlighted by arrows. Bars (clockwise from upper left) are 2, 2, 3, and 2 μm, respectively. D, electron micrograph of lipid bodies that accumulate in PITPα nullizygous hepatocytes. The right panel is a magnification of the region identified by the box in the left panel. One lipid body is membrane-enclosed (arrow), whereas the other lacks a distinct border and is interpreted to represent a large cytoplasmic lipid droplet. Bars (from left) are 2 and 0.4 μm, respectively.