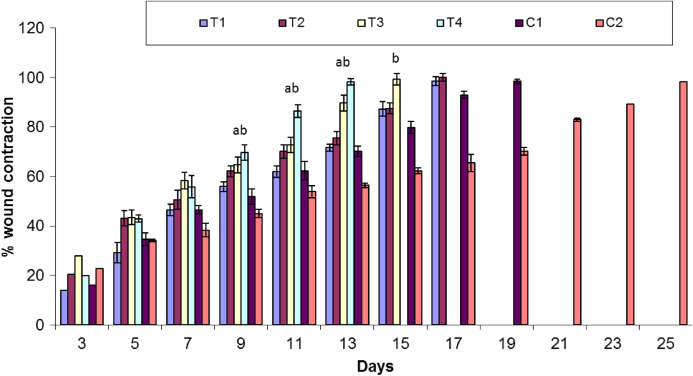
Figure 3. Comparison of percent wound contraction between treatment and control groups.
Keys: C1 = Positive control (Polyfax); C2 = Negative control (Saline solution); T1 = 5% Sericin; T2 = 5% Sericin and 5% Aloe vera gel; T3 = 5% Fibroin; T4 = 5% Fibroin and 5% Aloe vera gel. ‘a’ indicates the significance difference between C2 and T3, ‘b’ indicates the significance difference between C2 and T4, Each bar represents the mean values and SEM of six replicates. Statistical icons: a, b = p ≤ 0.05.

