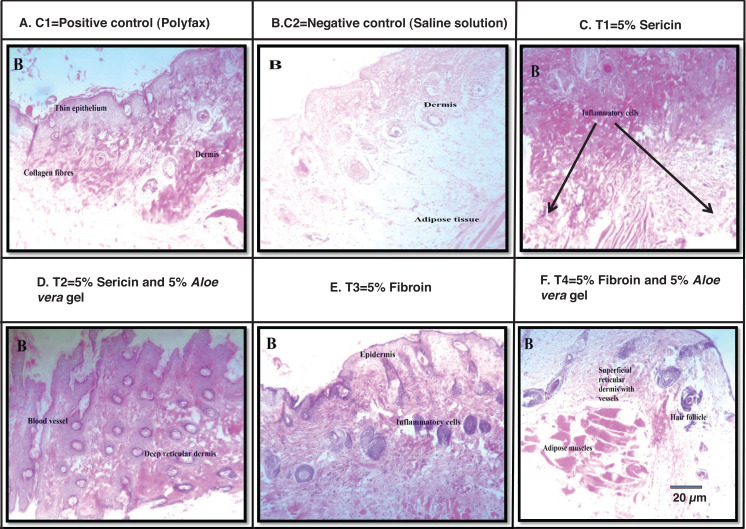
Figure 4. H & E staining showing the histological changes in diabetic mice skin at post-wounding day 10 in different treatment groups.
Magnifications of 10X. Scale bar = 100 μm. (A) C1 = Positive control (Polyfax); (B) C2 = Negative control (Saline solution); (C) T1 = 5% Sericin; (D) T2 = 5% Sericin and 5% Aloe vera gel; (E) T3 = 5% Fibroin; (F) T4 = 5% Fibroin and 5% Aloe vera gel.

