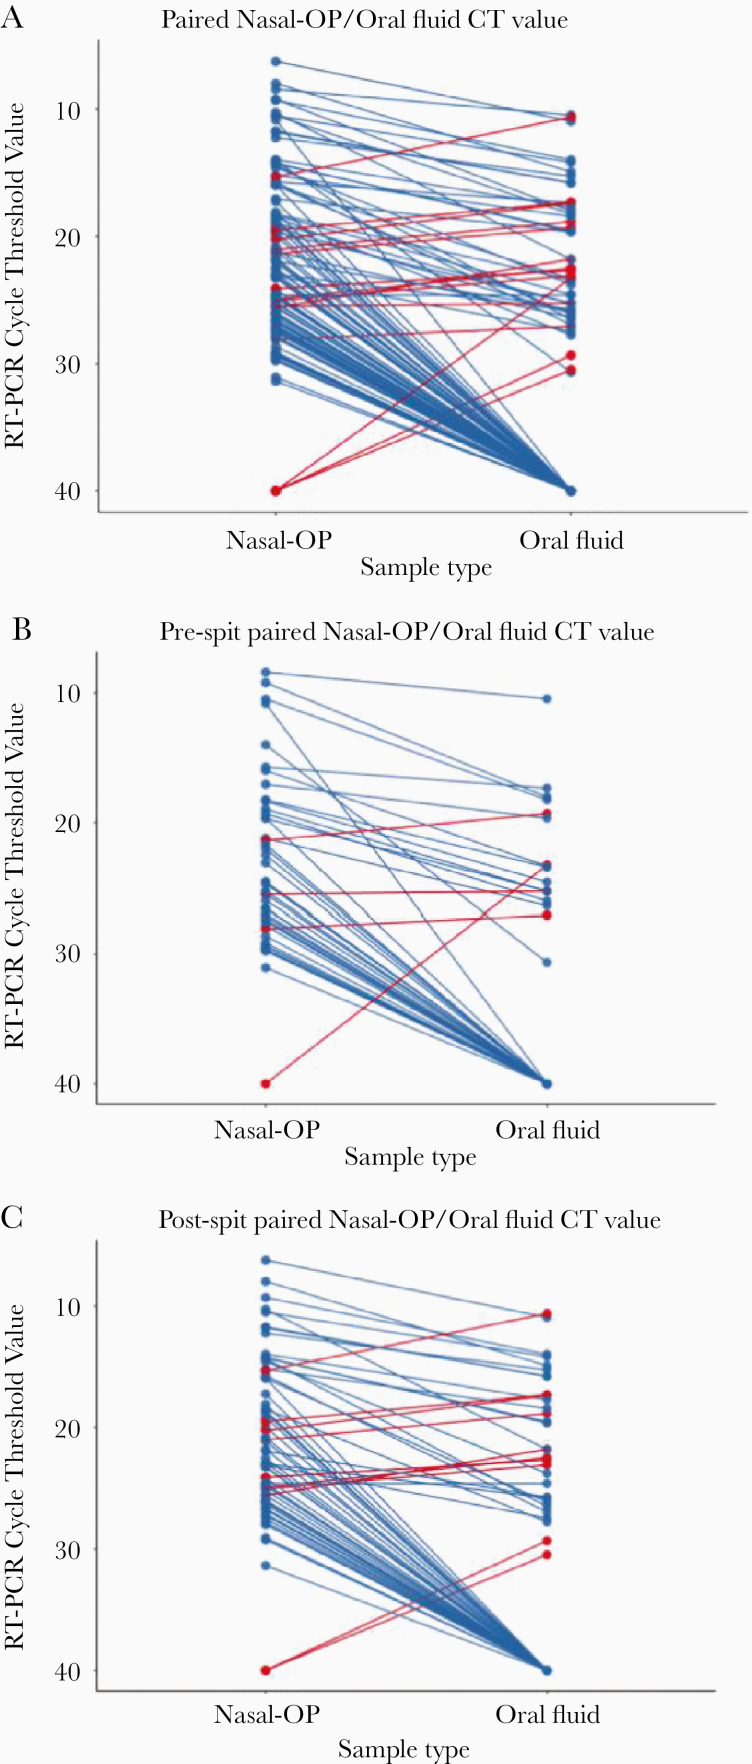
Figure 2.
Cycle thresholds (CT) are plotted for matched nasal-oropharyngeal (OP) swab and oral fluid real-time reverse-transcription polymerase chain reaction. Viral burdens that were higher in nasal-OP or oral fluid are shown in blue and red lines, respectively, in (A) all matched specimens, (B) oral fluid only, and (C) oral fluid plus the addition of spit. Samples that were negative in both sample types are not shown.

