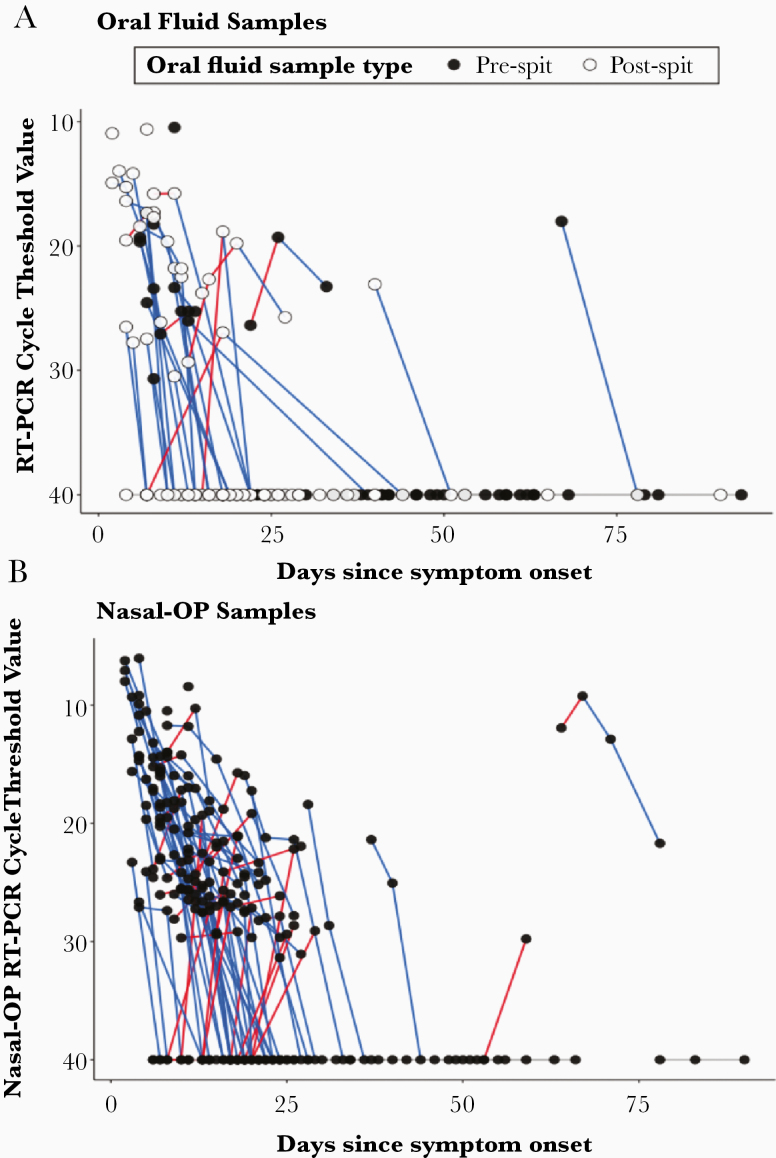
Figure 4.
(A) Cycle threshold values are shown for individual participants over time. Blue lines denote decreasing viral burden, whereas red lines represent increasing viral burden with increasing number of days after symptom onset in oral fluid. Samples where spit was added are shown in the open circles, and those with oral fluid only are in the black circles. and (B) nasal-oropharyngeal (OP) specimens.

