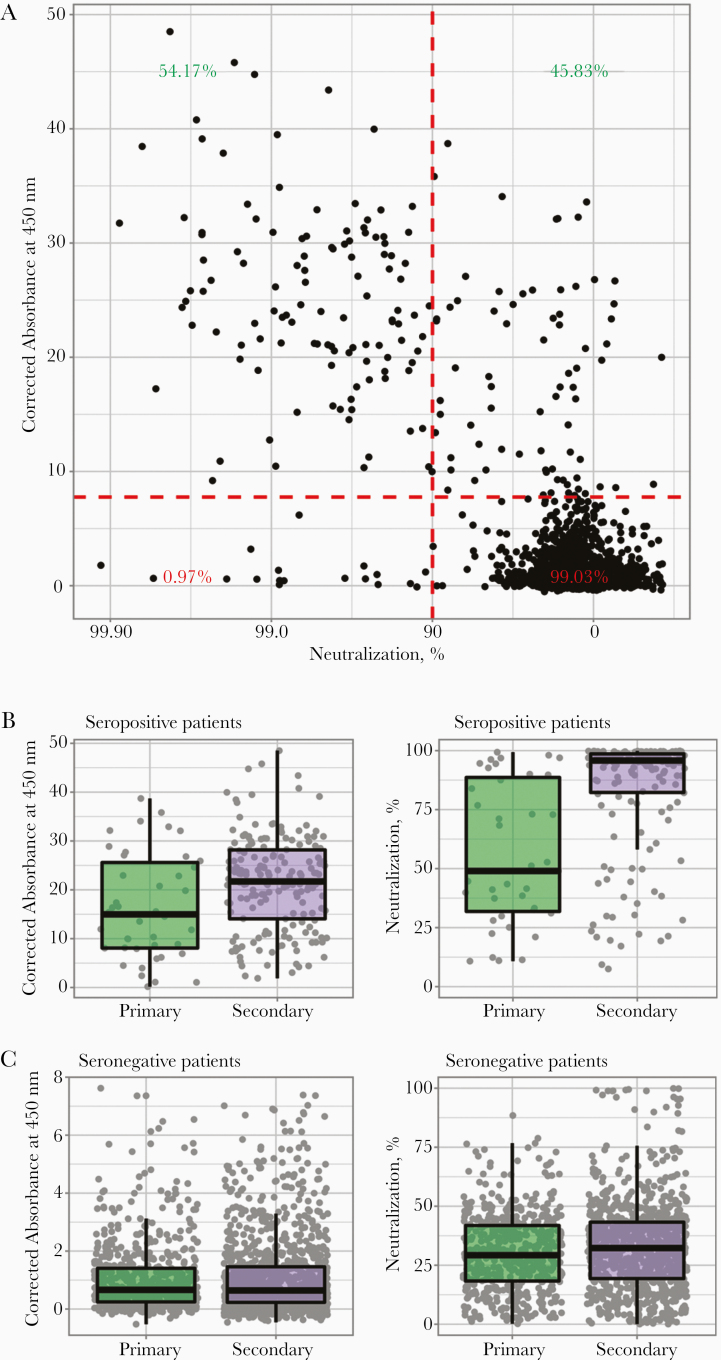
Figure 4.
Antibody levels and subsequent virus neutralization activity suggest an association with disease severity. A, Correlation between virus neutralization and antibody production is shown as a scatterplot, where every sample is represented by a black dot. Percentages reflect the sample distribution among seropositive patients (green numbers) and seronegative patients (red numbers), and between low (right) and high (left) virus neutralization. Enzyme-linked immunosorbent assay corrected-absorbance (left) and virus neutralisation (right) values are shown in patients seropositive B or seronegative C for acute respiratory syndrome coronavirus 2.

