Fig. 4.
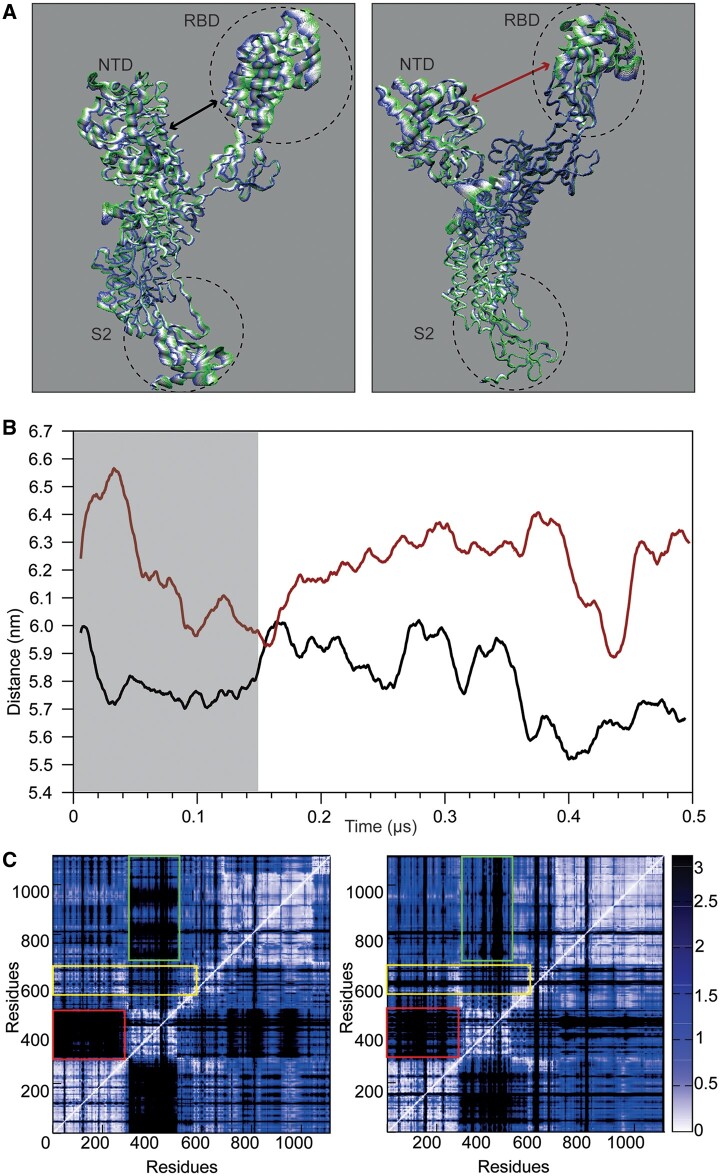
Principal component analysis of chain. (A) Projection of the motion along the first eigenvector for the chain A of D614 (left) and G614 (right). The color code from green to blue and the thickness of the tube identify the amplitude of the motion. (B) Evolution of the distance calculated between the center of mass of the NTD and the RBD in D614 (black) and G614 (red) as a function of time. (C) Distance fluctuation matrices calculated for chain A in D614 (left) and G614 (right). The rectangles underline the regions with differences between the two proteins.

