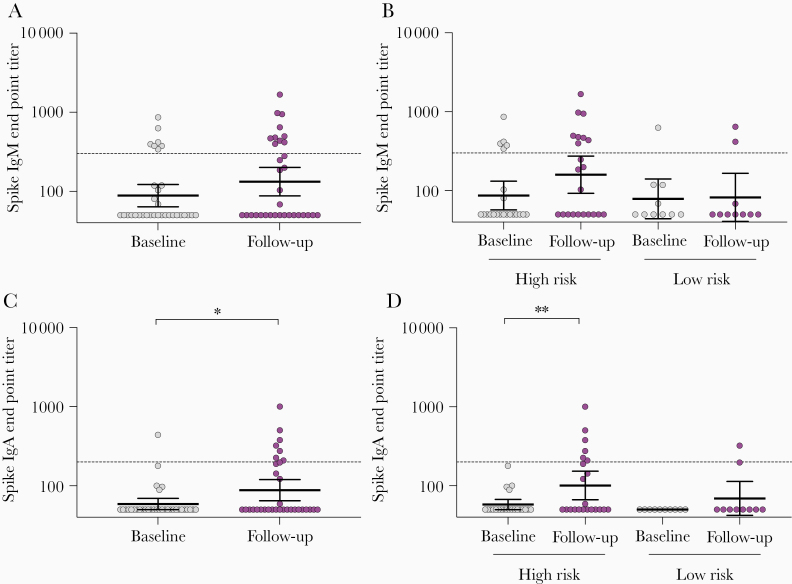
Figure 4.
SARS-CoV-2 spike-specific IgM and IgA antibodies in HCW before and after COVID-19 patient admissions. HCW with positive spike IgG results (n = 32) were further analyzed in spike IgM and IgA ELISA. A and C, Spike-specific IgM and IgA end point titers. B, and D, Spike-specific IgM and IgA end point titers in HCW in high-risk and low-risk groups. Each circle represents 1 HCW (gray baseline and purple follow-up). Horizontal lines represent geometric mean with 95% confidence interval. Dotted lines represent cutoffs for positive results, calculated as 3 standard deviations above the mean of the prepandemic negative sera (IgM end point titer ≥300, IgA end point tire ≥200). Individuals with undetectable antibodies were assigned an end point titer of 50 for plotting and calculation purposes. End point titers were log-transformed and compared between time points in mixed-effects models with adjustment for subject variation, age, sex, and other relevant demographic factors. *P < .05, **P < .01. Abbreviations: COVID-19, coronavirus disease 2019; ELISA, enzyme-linked immunosorbent assay; HCW, health care workers; IgG, immunoglobulin G; SARS-CoV-2, severe acute respiratory syndrome coronavirus 2.

