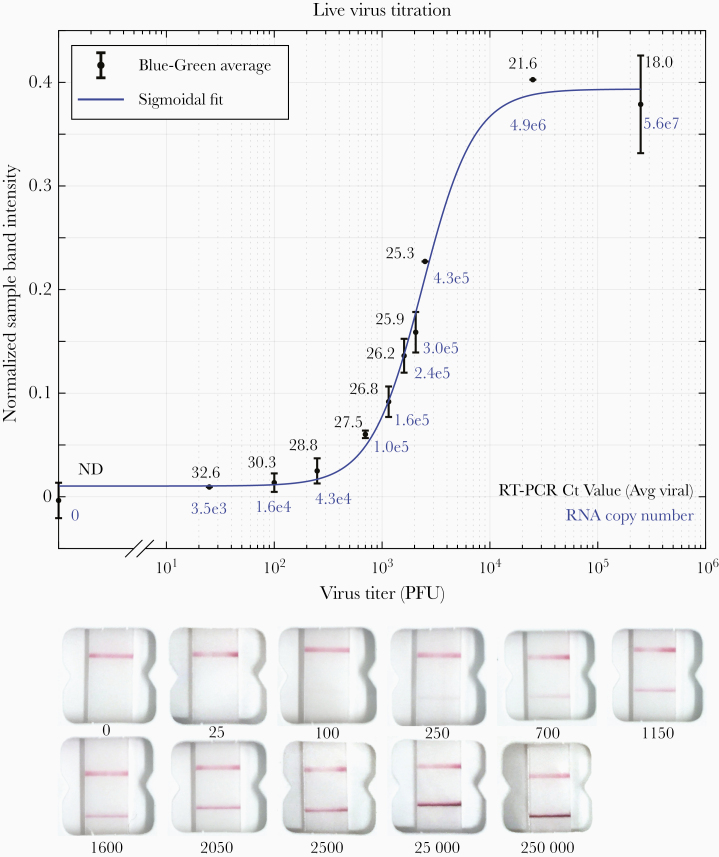
Figure 1.
Titration of in vitro grown severe acute respiratory syndrome coronavirus 2 and detection with Binax-CoV2 assay. Top, Normalized Binax-CoV2 sample band intensity (blue-green average) for cards loaded with a known amount of virus. Error bars represent standard deviation of sample band intensity of technical replicates. Reverse-transcription polymerase chain reaction (RT-PCR) testing was performed at the CLIAHUB consortium [10]. Corresponding RT-PCR cycle threshold (Ct) values (average of N and E gene probes) are shown in black, and the corresponding RNA copy numbers in blue. Note that Ct and genome copy number correlation varies by RT-PCR platform. Bottom, Representative card images from each data point. Abbreviation: PFUs, plaque-forming units.

