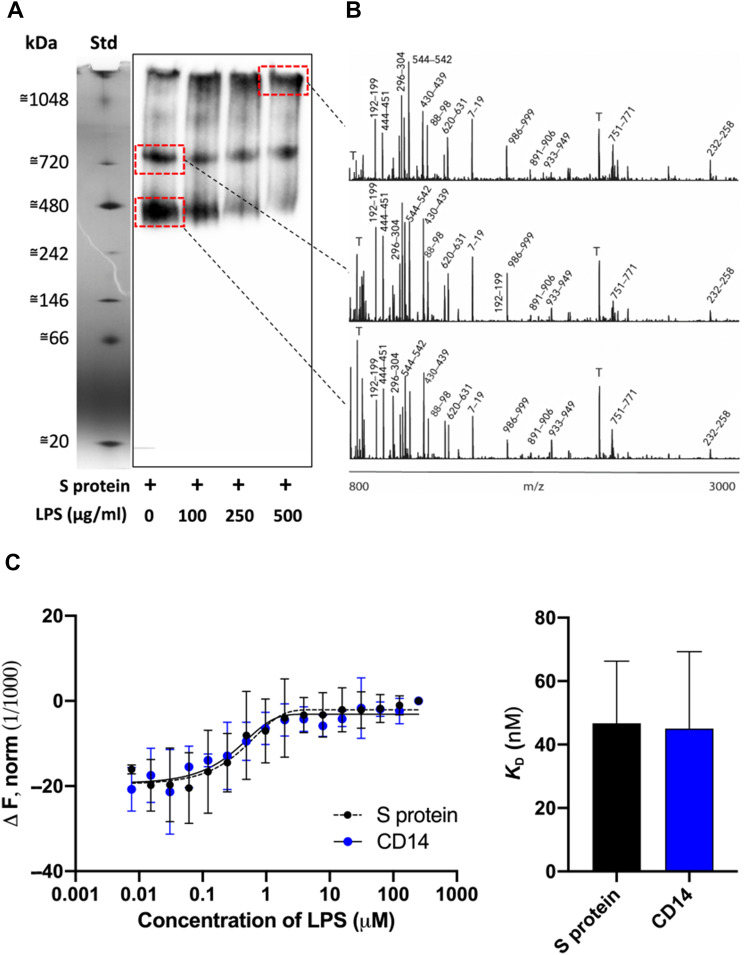
Figure 1.
Analysis of the interaction between SARS-CoV-2 S protein and LPS in vitro. (A) SARS-CoV-2 S protein was incubated with LPS (0‒500 µg/ml), separated using BN-PAGE and detected by western blotting. One representative image of three independent experiments is shown (n = 3). The marker lane is from the same gel but not transferred to the membrane. It is aligned and included for clarity. (B) Gel pieces corresponding to the area denoted by the dotted red squares on the western blot were cut out, in-gel digestion was performed, and the material was subjected to MALDI MS analysis. Representative high resolution MALDI mass spectra are presented. The most intense tryptic fragments obtained from S protein are denoted with the sequence numbers, and tryptic peptides from the autodigestion of trypsin are denoted with T. (C) MST assay quantifying SARS-CoV-2 S protein interaction with LPS. CD14 was used as positive control. KD constant for S protein = 46.7 ± 19.7 nM vs. CD14 = 45 ± 24.3 nM was determined from MST analysis. Mean ± SD values of six measurements are shown (n = 6).

