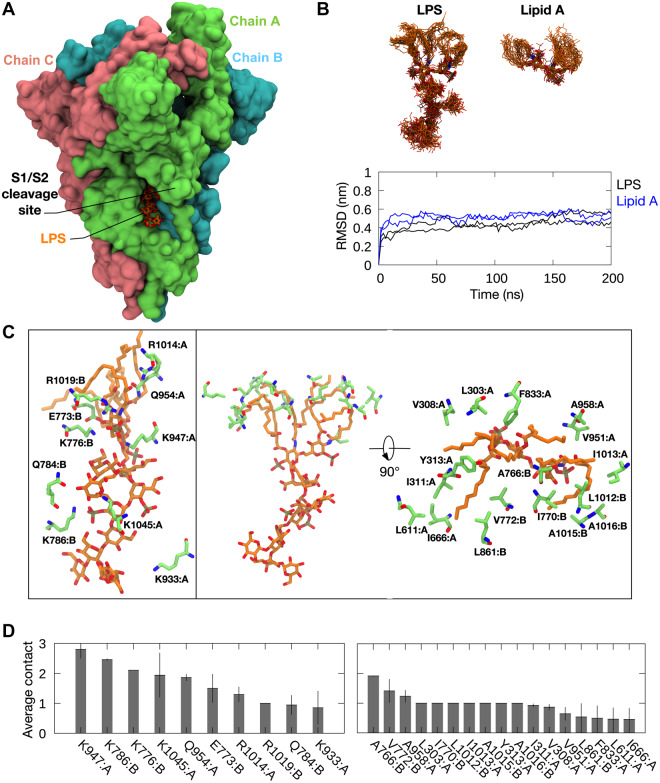
Figure 2.
Predicted LPS-binding site on SARS-CoV-2 S protein. (A) The proposed binding site of LPS (orange; stick representation) on S ECD (green, pink, cyan; surface representation). The S1/S2 furin cleavage site is labelled. (B) Top: snapshots of LPS and Lipid A overlaid on to one another, each taken every 10 ns from two independent 200 ns simulations of S ECD with LPS and Lipid A bound to the predicted binding site. Bottom: RMSD of LPS and Lipid A throughout the simulations. (C) S protein residues interacting with the LPS headgroup (left) and lipid tails (right) during these simulations. (D) The average number of contacts made by these residues with LPS headgroup (left) and lipid tails (right). Error bars show standard deviations between two repeat simulations.

