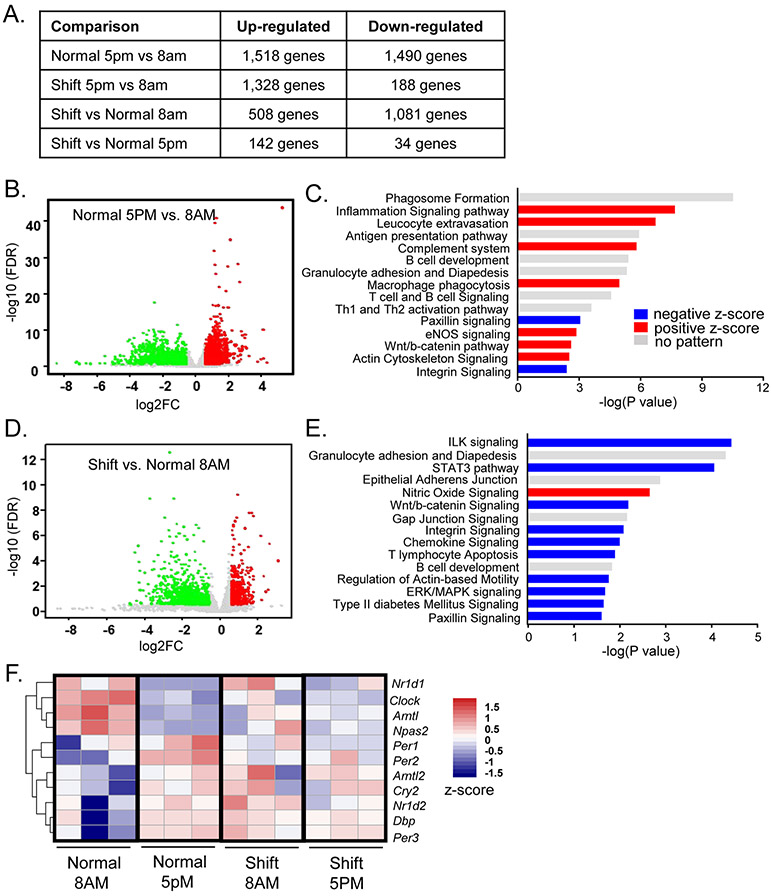
Figure 2.
RNA-seq analysis of chronic shiftwork-induced differentially expressed pathways in eWAT. (A) Hierarchical clustering of differentially expressed genes identified by RNA-seq of the four groups of eWAT samples analyzed, 8AM shiftwork, 8AM normal control, 5PM shiftwork, 5PM normal control (n=3/group). Each column represents a sample and each row corresponds to the annotate transcript with expression level shown according to the color scale. (B, C) Volcano plot of time-of-the-day dependent differentially expressed genes (B), and Ingenuity Pathway Analysis of top 15 differentially-regulated pathways (C) in eWAT between 5PM and 8AM in normal control groups (n=3/group). (D, E) Volcano plot of differentially expressed genes (D), and top 15 differentially-regulated canonical pathways induced by shiftwork as compared to normal controls in eWAT at 8AM (n=3/group) as identified by Ingenuity Pathway Analysis (−2.0 <Z score< 2.0) (E). Red horizontal bars indicate positive and blue for negative Z-score. (F) Heatmap representation of circadian clock gene regulation by shiftwork regimen in eWAT (8AM Shift/Normal). (E, F) Volcano plot of differentially expressed genes induced by shift vs. controls at 5PM (E, n=3/group) and time-of-the-day dependent differentially expressed genes in shiftwork group at 5PM as compared to 8AM (F, n=3/group). (G) Heatmap presentation of differentially regulated circadian clock genes by shiftwork regimen in eWAT (8AM Shift/Normal). Expression levels are shown according to color scale.

