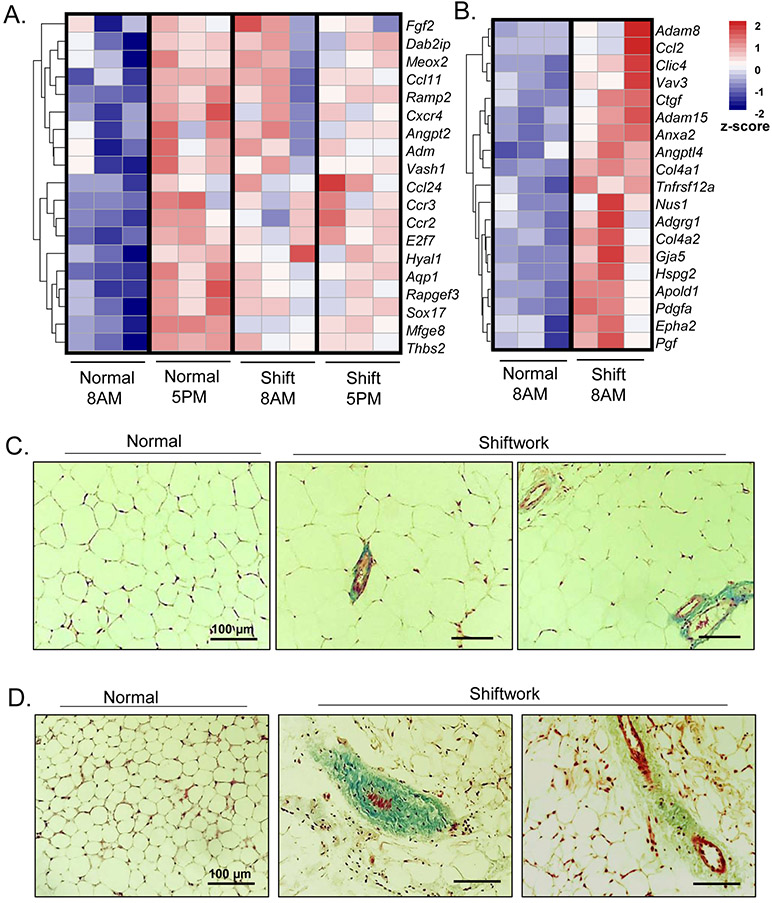
Figure 6.
Chronic shiftwork induces adipose tissue fibrotic response and angiogenic pathway. (A, B) Heatmap presentation of differentially-expressed genes involved in angiogenesis pathway in 6-month shiftwork and normal control groups at 8AM and 5PM in eWAT (A), and (B) 8AM samples in iWAT (n=3/group). Transcripts are annotated and expression levels shown according to color scale. (C, D) Representative images of Masson’s Trichrome staining of eWAT (C) and iWAT (D) in normal control and shiftwork groups. Scale bar: 100 μM.

