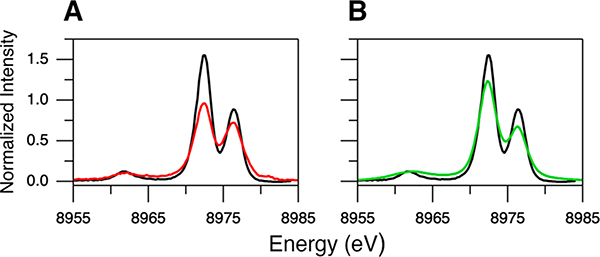
Figure 2.
Kβ VtC XES spectra of Cu(I)Cl. The black spectrum in (A) and (B) is the background-subtracted data for an excitation energy of 8987 eV. The red spectrum in (A) is the data after subtraction of the background and the DI emission features at ∼8980 and ∼8989 eV for an excitation energy of 10 500 eV. The green spectrum in (B) is the data after the intensity ratio correction from the red spectrum in (A).

