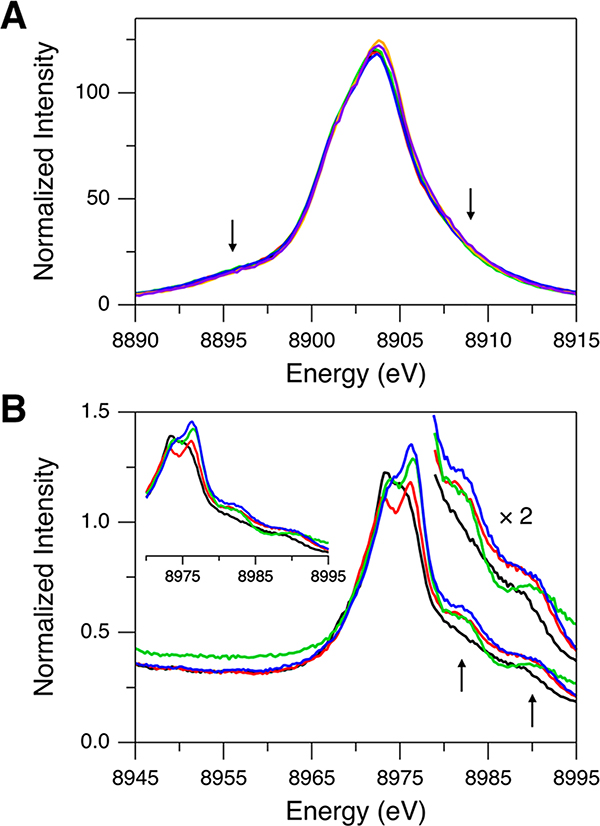
Figure 5.
Kβ XES spectra of complexes 1 (black), 2 (red), 3 (green), and 4 (blue) for (A) Kβ main and (B) Kβ VtC regions. Kβ main regions of Cu(I)Cl (orange, 10 500 eV excitation energy) and Cu(I)-GOpre (purple) are included in (A) for comparison. Arrows indicate the DI emission features. Insets in (B) show the expanded Kβ VtC XES data for better comparison of the Kβ2,5 and DI emission features.

