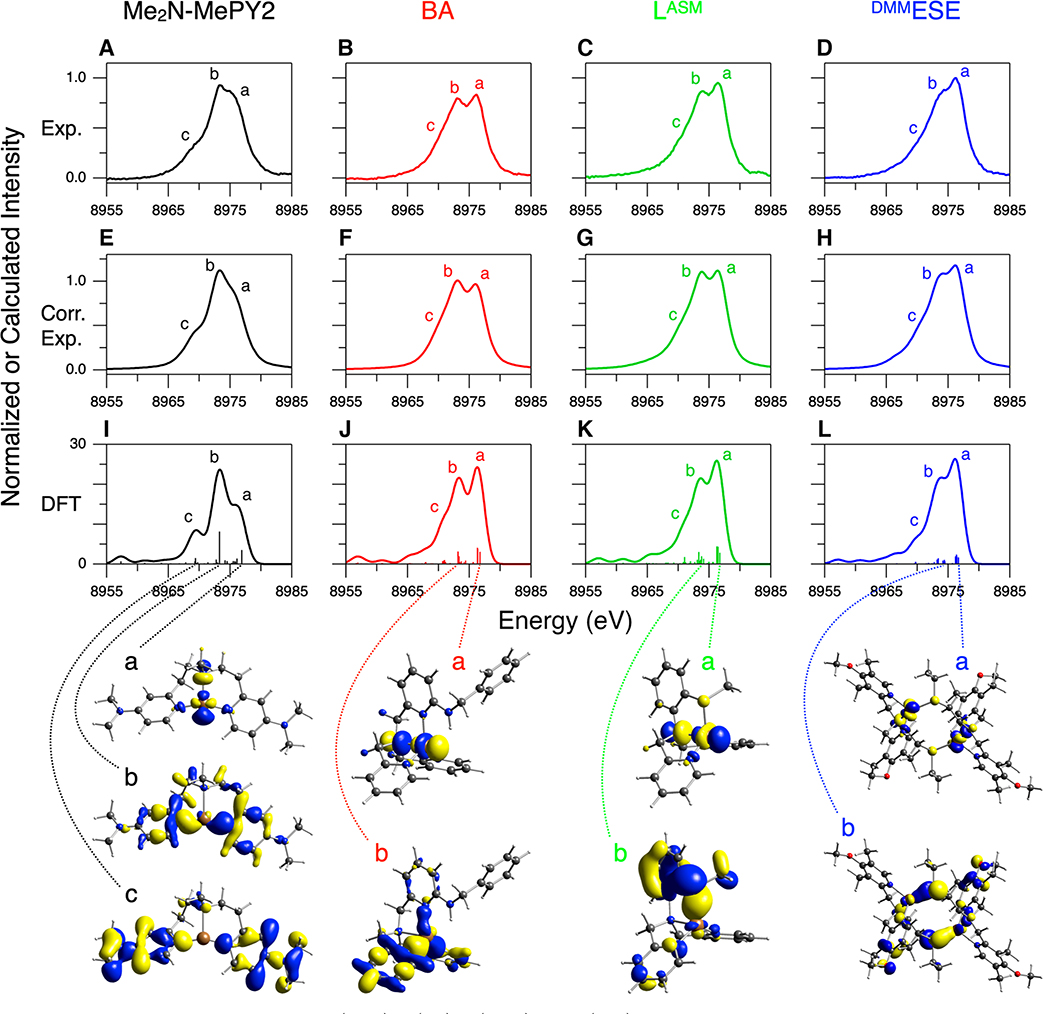
Figure 6.
Kβ VtC XES spectra of complexes 1 (black), 2 (red), 3 (green), and 4 (blue). The ligand names are shown at the top of each column. (A–D, Exp.) Experimental data after subtraction of the background and the DI emission features, (E–H, Corr. Exp.) experimental data after the further intensity ratio correction using correction factors in Table 1, and (I–L, DFT) DFT/BP86 calculated data using the optimized structures shown in Figure 4. Contour plots of selected MOs contributing to calculated transitions are shown at the bottom of each model and are correlated with the dotted lines (see Figures S8–S10 for complete sets of contour plots of MOs associated with intense transitions in complexes 2–4). The molecules are oriented similarly to the structures presented in Figure 4.

