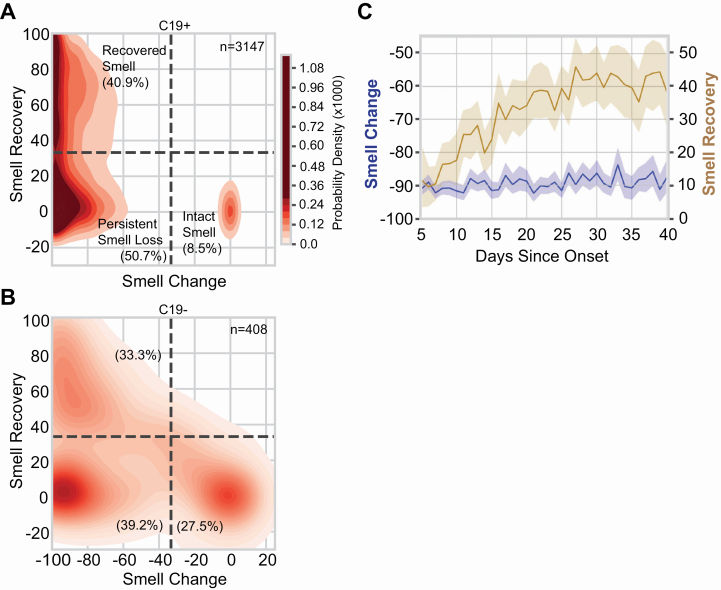
Figure 4.
Smell loss, recovery, and time course. (A, B) Joint distribution of smell loss (during minus before illness ratings) and smell recovery (after minus during illness ratings) for C19+ (A) and C19− (B) participants. Darker color indicates a higher probability density; the color map is shared between (A) and (B); dashed lines are placed at a third of the way across the rating scale to aid visualization of the clusters. Severe smell loss that is either persistent (lower left) or recovered (upper left) was more common in C19+ than C19−. n indicates the number of participants in each panel. % indicates the percentage of participants of the given COVID status in each quadrant. (C) In C19+ participants who lost their sense of smell (Recovered Smell + Persistent Smell Loss), the degree of smell recovery (right y axis) increased over ~30 days since onset of respiratory symptoms before plateauing; the degree of reported smell change (left y axis) did not vary in that window of observation. Solid lines indicate the mean of the measure, the shaded region indicates the 95% confidence interval.

