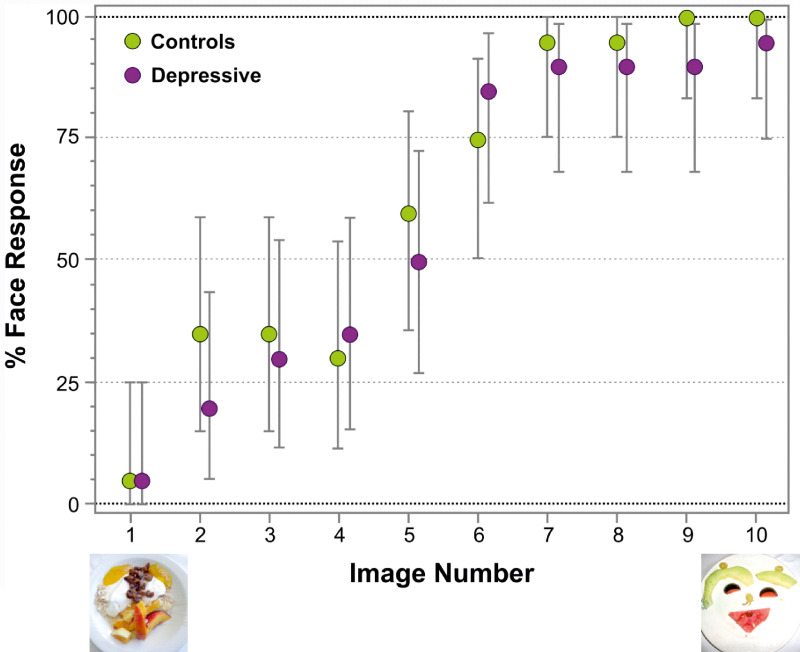
Figure 2.

Percentage of face responses for each Face-n-Food image in patients with major depressive disorder, MDD (violet) and typically developing, TD, controls (green). The image number reflects its face resemblance (1, the least resembling a face, through 10, the most resembling a face images from the Face-n-Food task; these images had been first published in Pavlova et al. 2015a; doi: 10.1371/journal.pone.0130363; the Creative Commons Attribution [CC BY] license). Vertical bars represent 95% confidence interval, CI.
