
Figure 3.
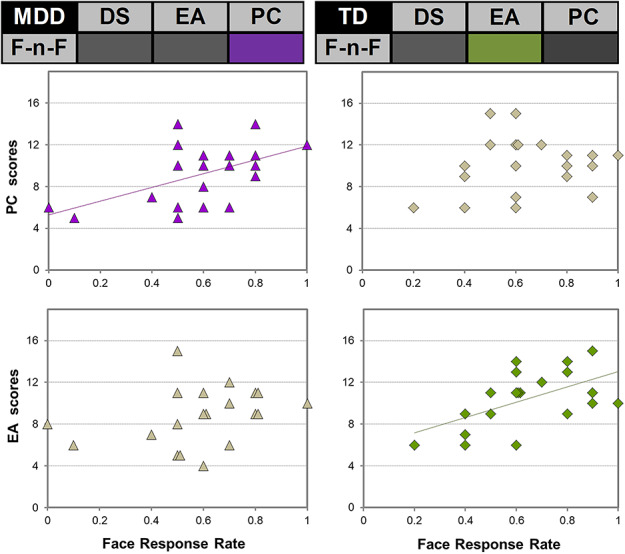
Relationship between the face response rate on the Face-n-Food task and scores on the digit span (DS), event arrangement (EA), and picture completion (PC) tests in MDD patients (left panel, triangles) and TD individuals (right panel, diamonds). In MDD, face response rate is positively linked with the scores on the PC test (violet; Pearson product–moment correlation, r(18) = 0.535, P = 0.015), whereas in TD, face response rate is associated with the scores on the EA test (green; r(18) = 0.563, P = 0.01). Correlation matrices on the top summarize these results.