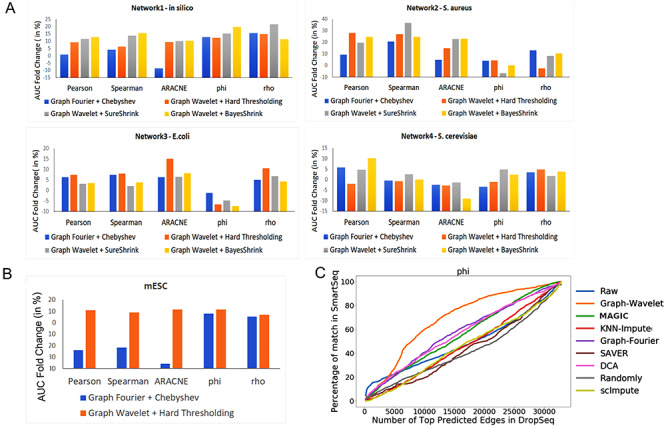
Figure 2.

Improvement in gene network inference by graph wavelet-based denoising of gene expression (A) Performance of network inference methods using bulk gene expression data sets of DREAM5 challenge. Three different ways of shrinkage of graph wavelet coefficients were compared with graph-Fourier-based low pass filtering. The Y-axis shows fold change in area under curve (AUC) for receiver operating characteristic curve for overlap of predicted network with golden set of interactions. For hard-threshold, the default value of 70% percentile was used. (B) Performance evaluation using single-cell RNA-seq (scRNA-seq) of mESCs-based network inference after filtering the gene expression. The gold set of interactions was adapted from [19] (C) Comparison of graph-wavelet-based denoising with other related smoothing and imputing methods in terms of consistency in the prediction of the gene interaction network. Here, Phi ( ) score was used to predict network among genes. For results based on other types of scores see Supplementary Figure S1. Predicted networks from two scRNA-seq profile of mESC were compared to check robustness towards the batch effect.
