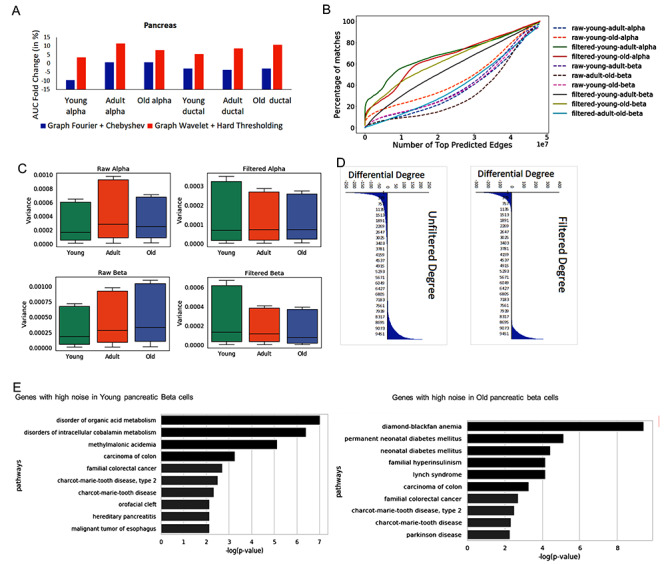
Figure 3.

Performance and analysis of noise for single-cell RNA-seq profile of pancreatic cells. (A) Performance based on overlap of predicted network with PPI data set. (B) Evaluation of consistency of predicted network. For comparing two networks, it is important to reduce differences due to noise. Hence, the plot here shows similarity of predicted networks before and after graph wavelet-based denoising. The result shown here are for correlation-based co-expression network, whereas similar results are shown using  score in Supplementary Figure S2. (C) Variances of expression of genes across single cells before and after denoising (filtering) are shown here. Variances of genes in a cell type were calculated separately for three different stages of ageing (young, adult and old). The variance (estimate of noise) is higher in older alpha and beta cells compared with young. However, after denoising variance of genes in all ageing stage becomes equal (D) Effect of noise in estimated differential centrality is shown is here. The difference in the degree of genes in network estimated for old and young pancreatic beta cells is shown here. The number of non-zero differential-degree estimated using denoised expression is lower than unfiltered expression-based networks.(E) Enriched panther pathway terms for top 500 genes with the highest drop in variance after denoising in old and young pancreatic beta cells.
