Figure 1.

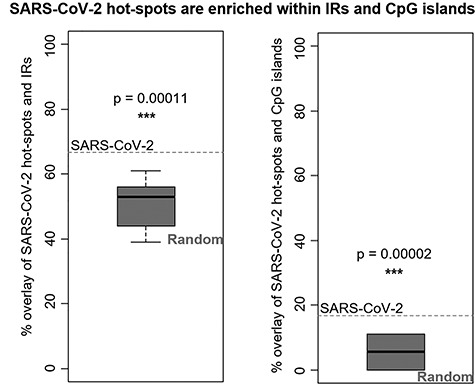
Overlay of SARS-CoV-2 hot-spot mutations with IRs in SARS-CoV-2 genome (left) and with CpG islands in SARS-CoV-2 (right) and comparison with random mutations (boxplots). One-sample t-test was used. *** indicates P-value < 0.001.

Overlay of SARS-CoV-2 hot-spot mutations with IRs in SARS-CoV-2 genome (left) and with CpG islands in SARS-CoV-2 (right) and comparison with random mutations (boxplots). One-sample t-test was used. *** indicates P-value < 0.001.