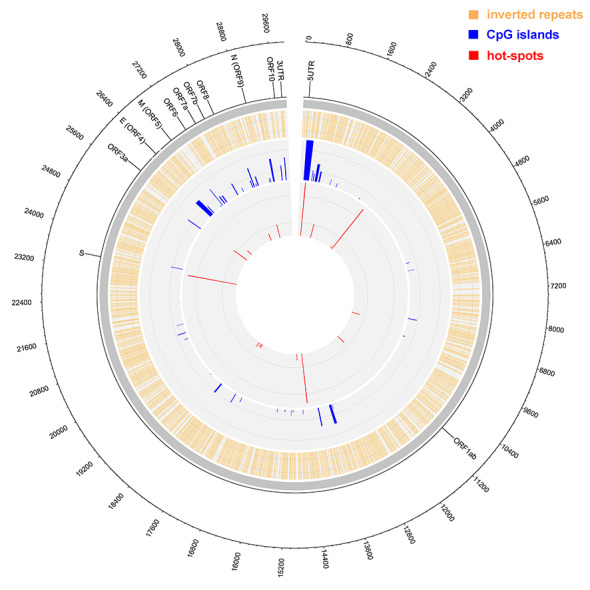
Figure 2.

Circos plot of IRs and CpGs overlay with SARS-CoV-2 hot-spot mutations. Outer circle—nucleotide positions, second circle—gene annotations (ORFs are designated by their common symbols [S for spike glycoprotein, E for envelope protein, M for membrane glycoprotein, and N for nucleocapsid phosphoprotein]). Orange—IR presence, blue—CpG island presence (heights of CpG peaks correspond proportionally to their score by newcpgpeak [higher peak = higher score]). Red—hot-spot mutations (heights of hot-spot mutations bands proportionally express their frequencies in all analyzed genomes). The grey circle separates the descriptive (outer) and analytics (inner) part of the plot.
