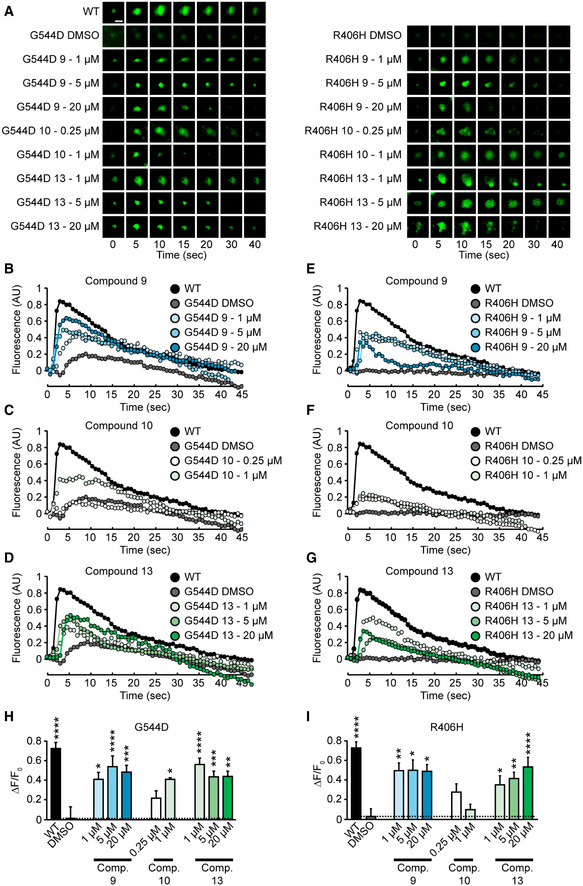
Figure 7. Rescue of evoked neurotransmitter release in mouse cortical neurons expressing mutant Munc18‐1.

-
A–GRepresentative images (A) or traces (B‐D & E‐G) of changes in fluorescence of synaptophysin‐pHluorin upon stimulation of neurons (scale bar in panel (A) = 2 µm).
-
H, IPlot of change in fluorescence from baseline to peak fluorescence for Munc18‐1 G544D (H) or R406H (I). Data are means ± SEM (*P < 0.05, **P < 0.01, ***P < 0.001, ****P < 0.0001 by one‐way ANOVA and Dunnett’s multiple comparison test; n = 7–23; exact n and P values are shown in Appendix Table S1). Note that compound 10 is fluorescent at a similar wavelength as pHluorin, so experiments at concentrations higher than 1 µM were not possible.
Source data are available online for this figure. Source data are available online for this figure.
