
Figure 2. Discovery and characterization of a potent and selective EP4 antagonist, TP‐16.
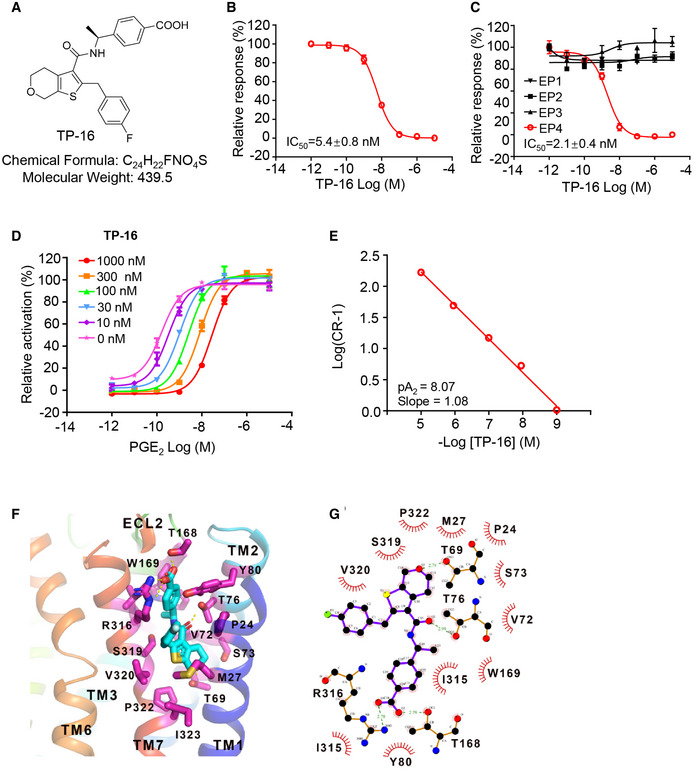
- Chemical structure of TP‐16.
- Dose–effect curve of TP‐16 in GloSensor™ cAMP assay in EP4‐ expressing 293 cells (n = 3).
- Dose–effect curves of TP‐16 in PGE2‐induced calcium flux assay (n = 3).
- The Schild plot of PGE2 in the presence of varying concentrations of TP‐16. TP‐16 shifted the dose–response curve of PGE2‐induced intracellular cAMP levels in a dose‐dependent manner (n = 3).
- The pA2 value and slope of the Schild plot.
- Docked pose of TP‐16 with critical residues in the putative binding pocket of human EP4 protein. EP4 is shown as a color cartoon, the residues important for the interaction are depicted in magenta sticks, and TP‐16 is shown as a cyan stick figure.
- The LIGPLOT diagram summarizes key interactions between TP‐16 (purple lines) and residues that originate from EP4. T69, T76, T168, and R316 establish hydrogen bonds with TP‐16. Semicircles with radiating lines indicate non‐polar interactions.
Data information: Data are presented as mean ± SEM from three independent experiments with similar results.