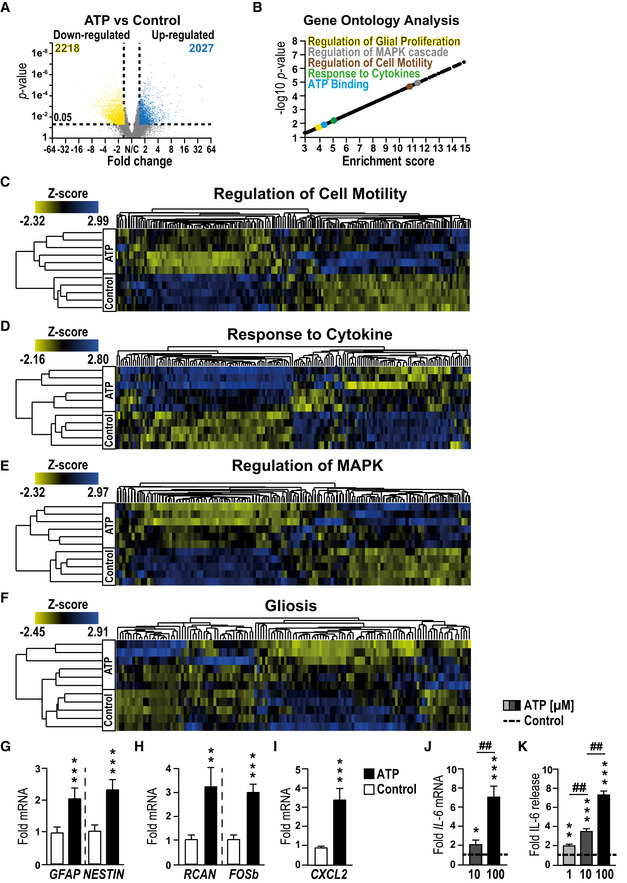
Figure 1. ATP induces a gliosis in msEGCs.

-
AVolcano plot showing significantly regulated genes between control and ATP‐treated msEGCs.
-
BVisual representation of GO terms associated with enriched genes in ATP‐treated msEGCs compared to control.
-
C–FHeat maps of indicated GO terms in ATP‐treated msEGCs compared to control.
-
G–IqPCR analysis of indicated gliosis genes in ATP‐treated EGCs.
-
JqPCR analysis of IL‐6 in msEGCs that were treated for 6 h with ATP.
-
KIL‐6 protein levels in supernatants from msEGCs collected after 24 h treatment with ATP.
Data information: In (A), data are shown as fold change > 1.5, P‐value < 0.05; (n = 5 for untreated and n = 6 for ATP‐treated EGCs). In (G–K), data are shown as fold change + SEM. (G–I) n = 6–9, msEGCs. (J) n = 4–9, msEGCs. (K) n = 6–18, msEGCs. In (A–I): ATP concentration was 100 µM. In (J, K), ATP concentration was 1, 10, or 100 µM. Statistics were performed by applying unpaired Student's t‐test (G–K) and/or one‐way ANOVA with a subsequent Bonferroni test (J and K). In (A) a limma‐trend pipeline model and in (B) the Fishers exact test were performed. * indicates significance to control, and # indicates significance to ATP treatment with *P < 0.05, **/## P < 0.01 and ***P < 0.001.
