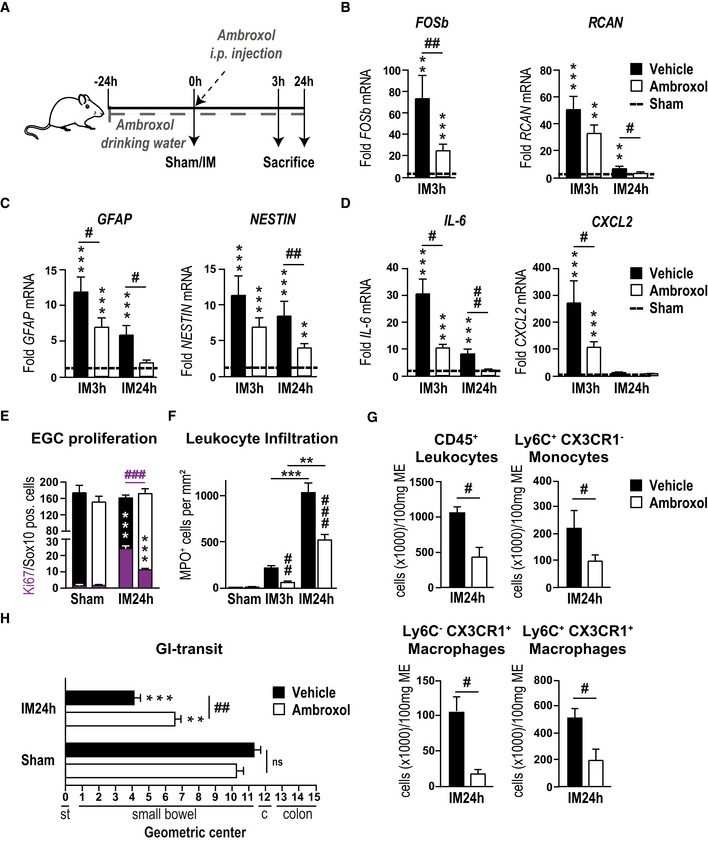
Figure 4. The novel P2X2 antagonist ambroxol prevents IL‐6 release from EGCs.

-
AAmbroxol treatment scheme. Mice were treated with ambroxol or vehicle and underwent a sham operation (laparotomy) or intestinal manipulation (IM). Small bowel muscularis externa (ME) was isolated and analyzed 3 or 24 h after surgery.
-
B–DPostoperative gene expression analyses of indicated gliosis marker in the ME.
-
EHistological analysis of EGC proliferation by quantification of Ki67 (violet)‐ and Sox10 ‐positive EGCs at IM24h. Mice were treated as seen in (A).
-
FHistological counting of infiltrating myeloperoxidase (MPO)‐positive leukocytes in the postoperative ME (n = 6–8).
-
GFACS analysis of infiltrating cells in the ME of mice treated with ambroxol or vehicle. CD45, Ly6C, and CX3CR1 were used to distinguish resident macrophages (CD45+/Ly6C−/CX3CR1+), infiltrating monocytes (CD45+/Ly6C+/CX3CR1−) and infiltrated monocyte‐derived macrophages (CD45+/Ly6C+/CX3CR1+).
-
HPostoperative in vivo GI transit measurement in mice treated with ambroxol or vehicle.
Data information: In (B–D), data are represented as fold change + SEM vs the sham groups (n = 6–8, POI mice per group). In (E), data are represented as mean of double‐positive cells per total Sox10‐positive cells + SEM; six whole mount specimens per conditions; n = 11 mice per IM group and n = 3 per sham group. In (F), data are presented as mean + SEM MPO+ cells/mm2 small intestine ME tissue. In (G), data are presented as cells per 100 mg ME tissue + SEM n = 3–5 POI mice per group. In (H), data are presented as mean + SEM; n = 12 mice per group. Statistics were performed by applying unpaired Student's t‐test and one‐way ANOVA with a subsequent Bonferroni test (B‐H). * indicates significance compared to sham animals, and # indicates significance between vehicle and ambroxol treatment with */# P < 0.05, **/## P < 0.01, and ***/### P < 0.001.
