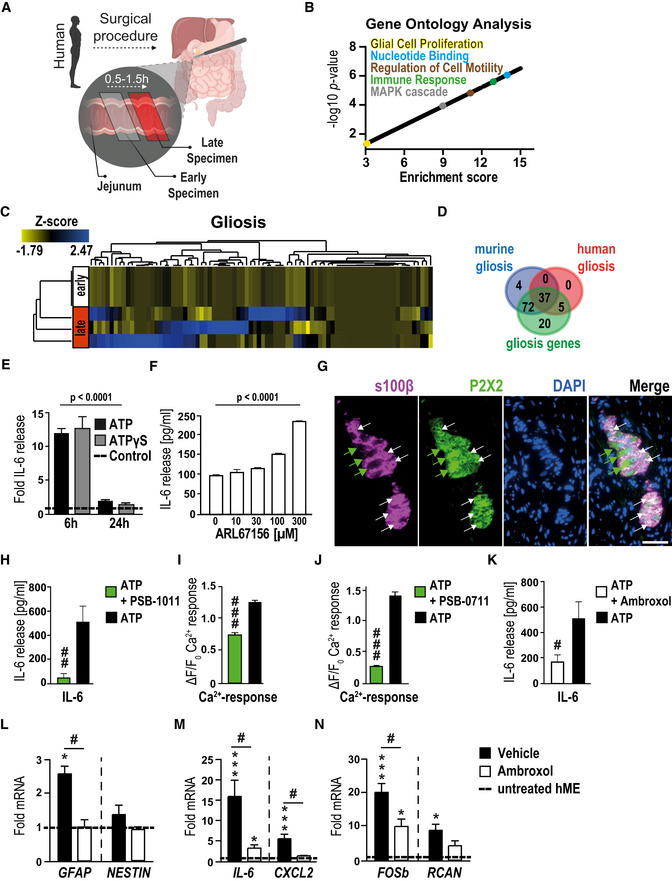
Figure 5. ATP induces gliosis in hEGC.

-
ASchematic workflow on the collection and processing of surgical specimens collected during a pancreaticoduodenectomy. Samples were provided on ice directly from the operation room, and the ME was separated from lamina propria mucosae.
-
BVisual representation of P‐value (−log10) against fold enrichment of GO terms associated with enriched genes in patient specimen that underwent IM.
-
CHeat map of enriched genes connected with GO term gliosis in patient specimens that underwent IM at two time points: early and late; n = 3 human patients.
-
DVenn diagram of gliosis genes expressed in human (red) and murine (blue) ME tissue.
-
EIL‐6 protein release in hEGC cultures upon stimulation with ATP (200 µM) or ATPɣS (100 µM) after 6‐h and 24‐h treatment (n = 4–6, hEGCs).
-
FIL‐6 protein release in hEGC cultures upon stimulation with NTPDase inhibitor ARL67156 at indicated concentrations; n = 4–6, hEGCs.
-
GImmunofluorescence microscopy revealed P2X2 expression (green) in a majority of s100β+ (violet) hEGCs in intact myenteric ganglia of the human colon. White arrows mark double‐positive glia cells, and green arrows mark P2X2‐positive neurons. Scale bar, 50 µm.
-
HEffect of the P2X2 antagonism on ATP‐induced IL‐6 release. ELISA measurement of IL‐6 in hEGCs upon treatment with P2X2 antagonist PSB‐1011 (20 µM) alone or together with ATP (200 µM) treated for 24 h (n = 6, hEGCs).
-
IPSB‐1011 (20 μM) treatment inhibited ATP‐triggered calcium responses in HEK cells transfected with P2X2. Data are represented as ΔF/F0 + SEM; n = 102 HEK cells.
-
JThe P2X2 receptor antagonist PSB‐0711 (20 μM) nearly abolished the ATP‐triggered calcium response in HEK cells transfected with P2X2. n = 219 HEK cells.
-
KAmbroxol blocks ATP‐induced IL‐6 release in hEGCs; protein release measurement by ELISA of IL‐6 in hEGCs. Cells were treated with ATP (200 µM) alone or together with ambroxol (20 µM) for 24 h; n = 6, hEGCs.
-
L–NqPCR analysis of several gliosis and ATP‐target genes in the mechanically manipulated surgical specimens incubated in the presence or absence of ambroxol (20 µM) (n = 7, 4 human patients).
Data information: In (E, F, H, and K), data are represented as mean IL‐6 release + SEM. In (I and J), data are represented as ΔF/F0 + SEM. In (L–N), data are shown as fold induction + SEM. Statistics were performed by applying unpaired Student's t‐test and one‐way ANOVA with a subsequent Bonferroni test (E and F, H–N), and in (B), the Fisher's exact test was performed. * indicates significance compared to controls, and # indicates significance to ATP treatment or between vehicle and ambroxol with */# P < 0.05, ## P < 0.01, and ***/### P < 0.001.
