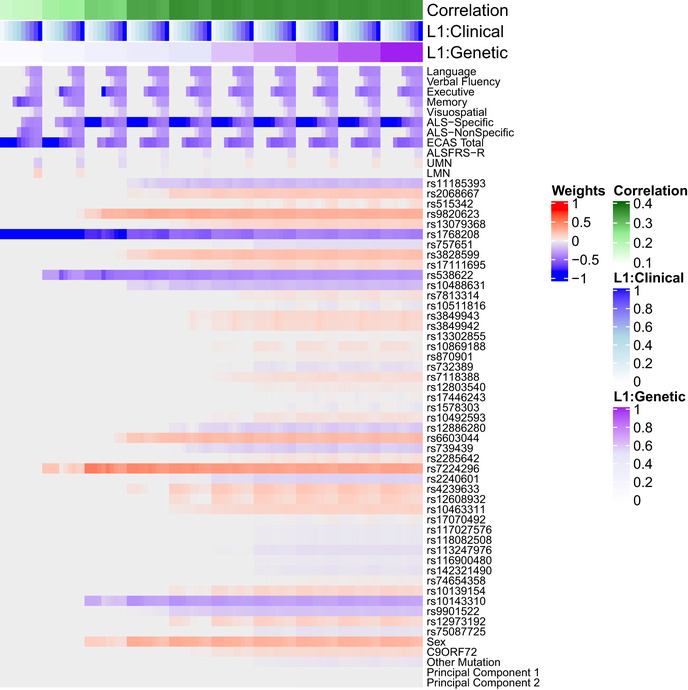
Figure EV1. Grid search for sCCA L1 parameters.

Each column indicates 1 of 100 unique combinations of L1 parameters (ranging 0.1 to 1) applied to clinical and genetic datasets, and each row lists a variable entered into the sCCA. The heatmap denotes the canonical weight strength for each variable; warmer colors indicate positive weights and cooler colors indicate negative weights.
