
Figure EV4. Univariate SNP associations with clinical variables from linear mixed effects modeling.
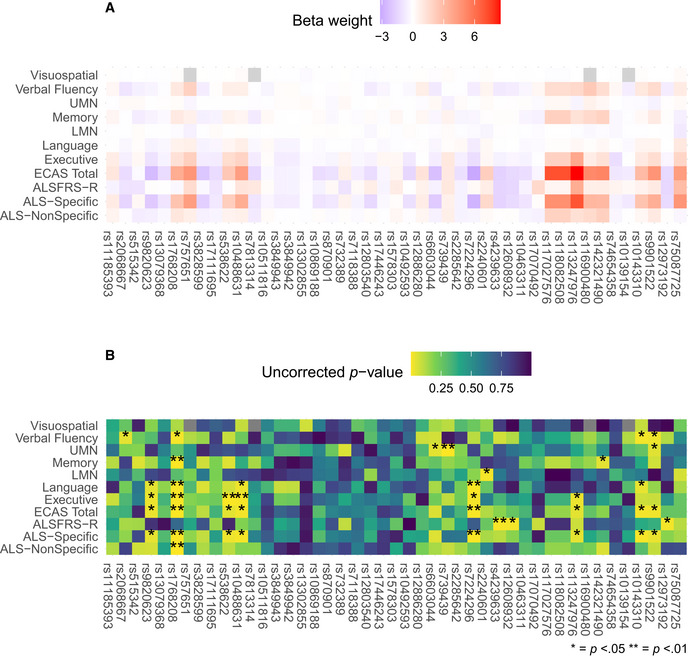
- Heatmap of beta weights associated with the fixed effect of each SNP with warmer colors representing positive values and cooler colors representing negative values.
- Heatmap of the p value corresponding to the t value for the beta weights depicted in A, with brighter colors representing smaller values and darker colors representing larger values. A single star (*) denotes P < 0.05, and two stars (**) denote P < 0.01.