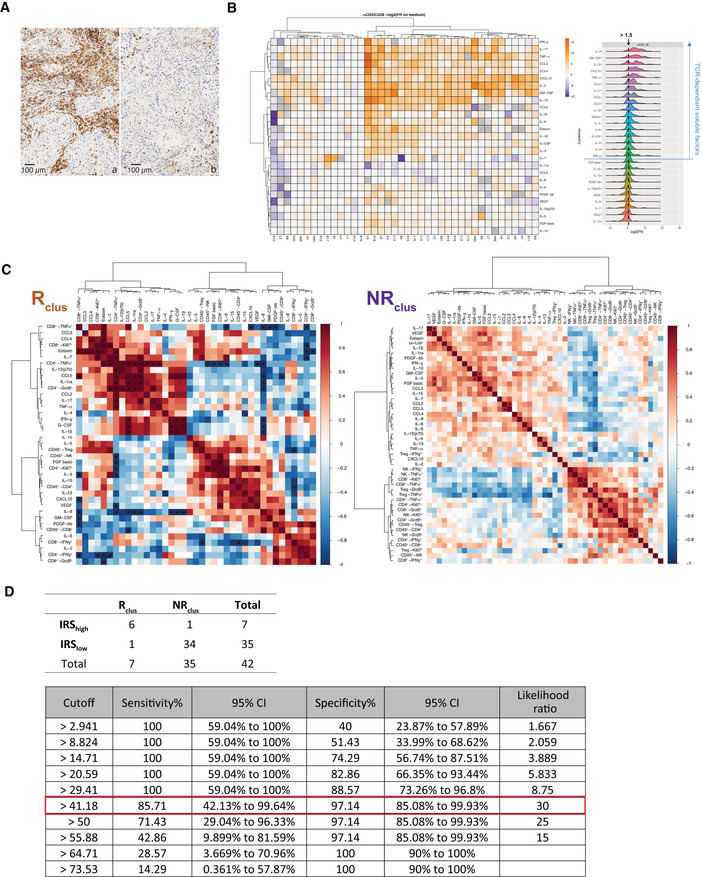
Figure EV1. TCR‐dependent soluble factors (SF) and correlations with immune effector functions after PD‐1 blockade.

- Representative micrograph pictures of TIL densities in stroma surrounding the tumor or tumor nests in two cases containing high (15%, (A)) or low (0.7%, (B)) CD45+ TILs in a surgical specimen. Scale bar representing 100 µm is indicated on the picture.
- Left panel: Heatmap of the non‐supervised hierarchical clustering using 27 SFs, segregating patterns of immune reactivity of the TME (n = 42) following a 60‐h stimulation with anti‐CD3 and anti‐CD28 mAbs (TCR cross‐linking). The heatmap shows z score‐normalized concentration of soluble factors. Each column represents a tumor and each row a SF. Fold ratio of SF concentrations after TCR cross‐linking over the concentrations in untreated cells (medium) were log2 transformed. Similar data were obtained using isotype control mAbs instead of medium (Appendix Fig S2). The color gradient from purple up to orange indicates increasing gradients of concentrations. Missing values are shown in gray. Both rows and columns are clustered using correlation distance and average linkage. Right panel: distribution of fold ratio of each SF following TCR cross‐linking.
- Spearman correlation matrices of SFs and FACS‐based effector functions post‐PD‐1 blockade (fold ratio over medium) for Rclus and NRclus tumors according to the clustering of Fig 1B. For each tumor sample, only FACS‐based effector functions with data ≥ 500 events in are represented here. *P values < 0.05.
- Assessment of the concordance of the clustering score (Rclus and NRclus) and the immune responsive score (IRSlow and IRShigh; above) and corresponding sensitivity and sensibility values of the IRS for the 42 patients (below). The best cutoff value with the highest likelihood ratio is framed in red.
Source data are available online for this figure.
