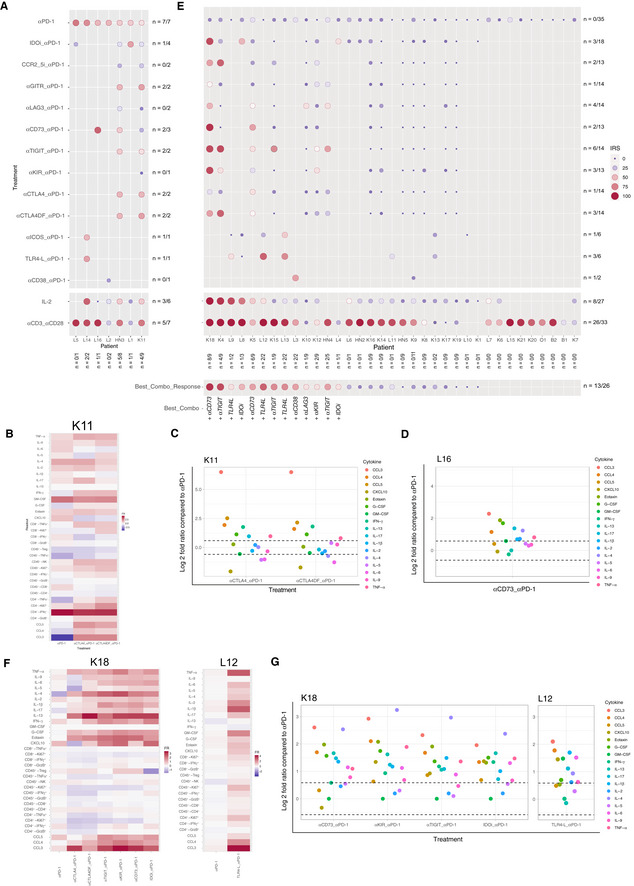
Figure 3. Reactivating anergic TME with anti‐PD‐1 mAb‐based combinatorial regimen.

-
A–G(A, E) The IRS was determined for each tumor after PD‐1 blockade alone (top line), or combined with immunomodulators in two groups of tumors (IRSanti‐PD‐1> (A) or < 41.18 (E)). The size and color of the bullet both correspond to the IRS. The “n” corresponds to the number of immune reactive tumors for each combination (horizontally) and to the number of combinations that induced a positive immune reactivity (≥ 41.18) per tumor (vertically). Best corresponding combination responses are indicated below for each patient. Note that these experiments do not allow to establish direct comparisons of relative efficacy in‐between each compound, given the limited amount of samples tested, the lack of dose ranges tested for each compound and/or sample availability. (B–D, F, G) Focus on four cases for the reactivity to anti‐PD‐1 mAbs alone or combined with immune checkpoints. Heatmap depicting the fold ratio for each immunometrics between stimulation with mAbs vs medium and raw data illustrating the increase of the soluble factors (SFs) of the combinations compared to anti‐PD‐1 alone.
