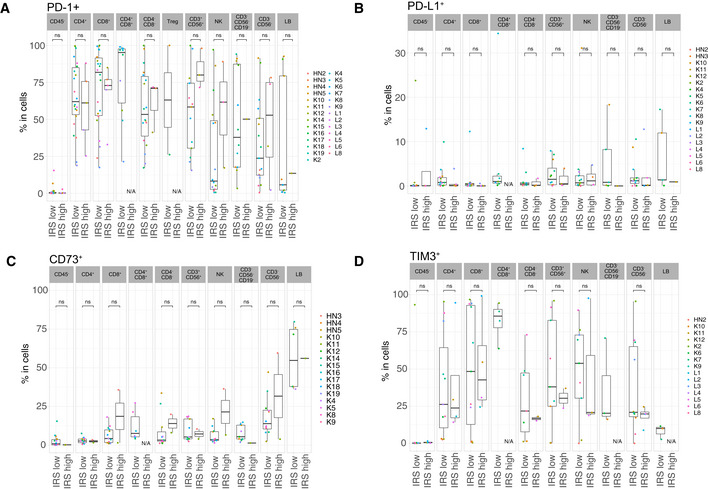
Flow cytometry determination of various cell surface markers (as indicated) within different tumor immune subsets or CD45‐ cells between the two groups of tumors (IRS
high vs IRS
low), according to the clustering depicted in Fig
1D. Box plots display group of numerical data through their 3
rd and 1
st quartiles (box), mean (central band), minimum and maximum (whiskers). In each bar graph, each dot represents one tumor. Statistical analyses: Wilcoxon rank‐sum test, ns.
P > 0.05. Only data ≥ 500 events were plotted here. N/A: data not available or < 500 events.

