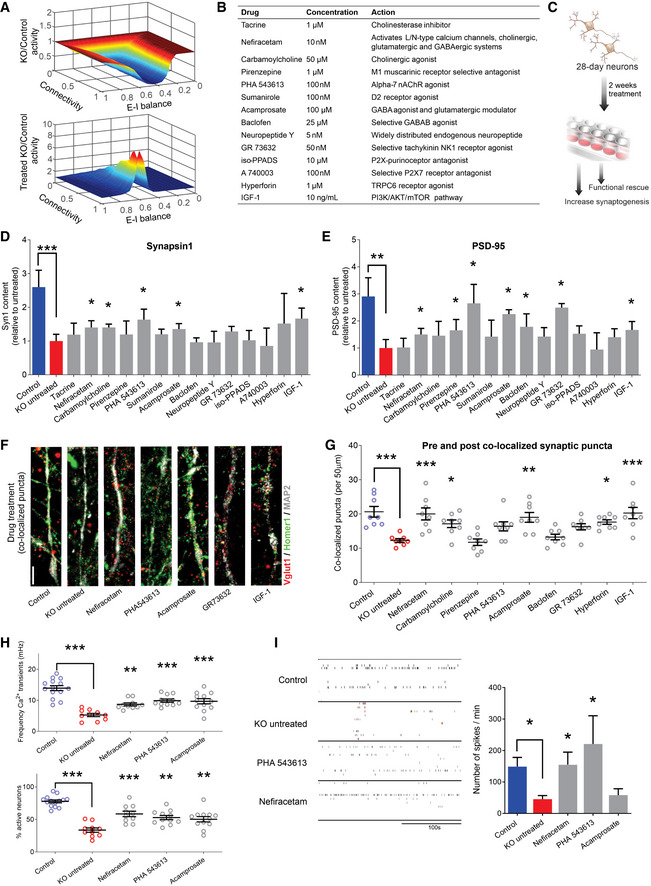
Figure 2. Screening selected drugs with synaptic action in human neurons identifies Nefiracetam and PHA 543613 as top treatment candidates for MeCP2 deficiency.

-
AIn silico neural network modeling using our previous synaptic puncta values for untreated (top, knockdown (KD) [6/16] = 0.375*control) and treated (bottom, KD [24/16] = 1.5*control) RTT neurons (Marchetto et al, 2010) suggested that isolated increase of synaptic knockdown sufficiently increases neural activity (untreated, mean = 0.665, range = [0.050,1.002]; treated, mean = 1.542, range = [0.997,8.395]). For excitatory‐inhibitory (E–I) balance, “0” is fully excitatory, “1” is fully inhibitory.
-
BList of compounds for the phenotypic screening. The compounds were selected for mechanisms of action that counteracted the neurotransmitter deficiencies observed in Fig 1. The final concentration was determined based on previous studies.
-
CSchematic of drug treatment workflow. Briefly, 28‐day‐old MECP2‐KO neurons were treated for 2 more weeks prior to performing phenotypic reversal experiments.
-
D, EWestern blot quantification showed decreased presynaptic Synapsin1 (D) and postsynaptic PSD‐95 (E) in untreated 6‐week MECP2‐KO neurons that can be increased by drug treatment (Kruskal–Wallis test, *P < 0.05, **P < 0.01, ***P < 0.001; full Western blot, Fig EV4A; WT83/Q83X cell lines were used; N = 3 clones from each genotype).
-
F, G6‐week MECP2‐KO neurons (F) showed a pharmacologically rescuable reduction of co‐localized synaptic puncta (G; one‐way ANOVA, F 16,118 = 9.148, *P < 0.05; Dunnet’s multiple comparisons test vs. untreated KO (WT83/Q83X cell lines were used; N = 7–8 neurons/condition). *P < 0.05, **P < 0.01, ***P < 0.001. Z scores relative to KO untreated: Control = 3.903; Nefiracetam = 3.560; Carbamoylcholine = 2.705; Pirenzepine = 0.0448; PHA543613 = 2.121; Acamprosate = 3.339; Baclofen = 0.5672; GR73632 = 2.237; Hyperforin = 3.016, and IGF‐1 = 3.791. Scale bar = 5 µm.
-
HDrug treatment increased calcium transient frequency in 6‐week neurons. Fluorescence intensity changes reflecting intracellular calcium transients in neurons in different regions of interest (one‐way ANOVA, F 4,52 = 20.28, Dunnett’s multiple comparisons test vs. untreated KO: Nefiracetam, **P < 0.01 and Z = 2.364; PHA 543613, ***P < 0.001 and Z = 3.391; Acamprosate, ***P < 0.001 and Z = 3.153; WT83/Q83X cell lines were used; N = 10–14 neurons/condition) and the percentage of active neurons (one‐way ANOVA, F 4,52 = 23.11; Dunnett’s multiple comparison test vs. untreated KO: Nefiracetam, ***P < 0.001 and Z = 3.144; PHA 543613, **P < 0.01 and Z = 2.567; **Acamprosate, P < 0.01 and Z = 2.285; N = 10–14 neurons/condition).
-
ITreatment with either Nefiracetam or PHA 543613 increased network spiking activity in MECP2‐KO neurons on MEA (two‐sided unpaired Student’s t‐test compared with KO untreated: Nefiracetam, *P = 0.016 and Z = 2.418; PHA 543613, *P = 0.027 and Z = 2.147; Acamprosate, P = 0.39 and Z = 0.477; WT83/Q83X and WT82/K82fs cell lines were used; N = 4–11 MEA wells/condition).
Data information: Note that asterisks signify statistically significant difference from MECP2‐KO untreated. Data are presented as mean ± s.e.m.
