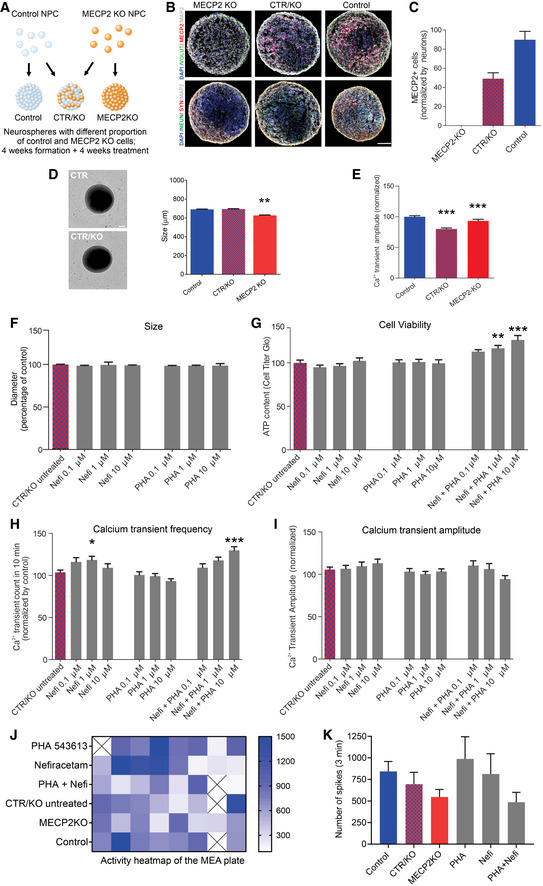
Figure 3. Treatment of MECP2‐mosaic neurospheres with Nefiracetam and PHA 543613.

-
ASchematic showing the formation of control, MECP2‐KO, and mosaic MECP2‐KO/control neurospheres (WT83/Q83X cell lines were used).
-
B, CImmunofluorescent staining (B) and quantitation (C) confirmed the graded decrease in MeCP2 expression from control to 50% MECP2‐mosaic to full MECP2‐KO neurospheres. Scale bar = 50 µm.
-
D8‐week MECP2‐KO neurospheres (N = 44) exhibited decreased size (diameter; **P < 0.01), but 50% MECP2‐mosaic neurospheres (CTR/KO; N = 44) were unchanged from controls (one‐way ANOVA, F 2,150 = 6.03, P = 0.003; Dunnett’s multiple comparisons test; N = 65). Left: representative bright‐field images of neurospheres; Right: neurosphere size quantification. Scale bar = 200 µm.
-
ECalcium imaging analysis showing calcium transients normalized by control (one‐way ANOVA, F 2,72 = 15.62, P < 0.0001; Dunnett’s multiple comparisons test vs. control: MECP2‐mosaic, ***P < 0.001; MECP2‐KO, ***P < 0.001). WT83/Q83X cell lines were used; N = 44 Q83X neurospheres and 65 WT83 neurospheres.
-
F8‐week neurosphere size (diameter) remained unchanged by treatment with either drug (one‐way ANOVA, F 6,344 = 0.52, P = 0.79; N = 44 Q83X neurospheres and 65 WT83 neurospheres).
-
GCell viability was improved or unharmed in treated 8‐week neurospheres (one‐way ANOVA, F 9,104 = 6.81; Dunnett’s multiple comparisons test vs. CTR/KO untreated: Nefi + PHA 1 µM, **P < 0.01 and Z = 2.974; Nefi + PHA 10 µM, ***P < 0.001 and Z = 3.733; N = 8–24 neurospheres per condition).
-
H, ICalcium transient frequency (number of peaks in 10 mins recording) normalized by CTR/KO untreated (H; one‐way ANOVA, F 9,239 = 6.18; Dunnett’s multiple comparisons test vs. CTR/KO untreated: Nefi 1 µM, *P < 0.05 and Z = 0.780; Nefi + PHA 10 µM, ***P < 0.001 and Z = 1.972; N = 15‐61 neurospheres per condition) and calcium transient amplitude normalized by CTR/KO untreated (I; one‐way ANOVA, F 9,241 = 1.27, P = 0.255; N = 16–62 neurospheres per condition).
-
J, KMEA spike frequency heatmap (J) and quantification (K) normalized by CTR/KO untreated (one‐way ANOVA, F 5,38 = 1.21, P = 0.321; Dunnett’s multiple comparisons test vs. CTR/KO untreated: PHA, P = 0.65 and Z = 1.134; Nefi, P = 0.98 and Z = 0.06; PHA + Nefi, P = 0.86 and Z = 0.94; N = 7‐8 wells per condition). ‘X’ on activity heatmap signifies absence of a neurosphere in that position.
Data information: Nefi: Nefiracetam; PHA: PHA 543613. Note that asterisks in F–K signify a statistically significant difference in treated MECP2‐mosaic (CTR/KO) neurospheres compared with untreated CTR/KO neurospheres. Data are presented as mean ± s.e.m.
