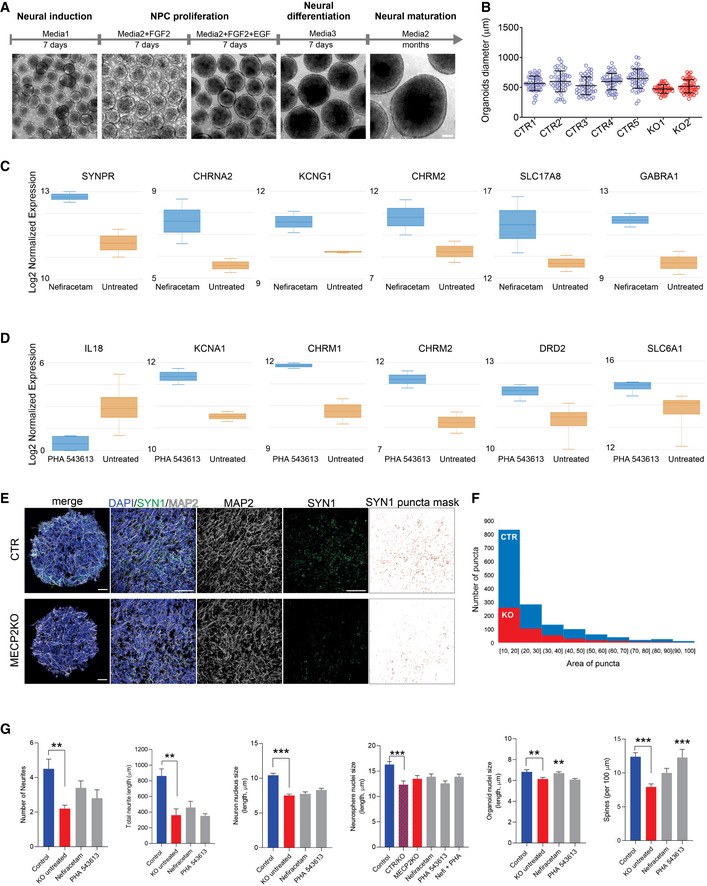
GNefiracetam and PHA 543613 treatment did not rescue MECP2‐KO neuronal morphology, for either the number of neurites (Kruskal–Wallis test, P = 0.011; Dunn’s multiple comparisons test vs. KO untreated: control, **P = 0.01 and Z = 3.13; Nefiracetam, P = 0.49 and Z = 1.74; PHA 543613, P > 0.99 and Z = 0.87; WT83/Q83X and WT82/K82fs cell lines; N = 5–10 neurons per condition) or the total neurite length (one‐way ANOVA, F
3,21 = 9.62, P = 0.0003; Dunnett’s multiple comparisons test vs. KO untreated: control, **P = 0.002 and Z = 3.08; Nefiracetam, P = 0.89 and Z = 0.64; PHA 543613, P = 0.99 and Z = 0.17; WT83/Q83X and WT82/K82fs cell lines; N = 5–10 neurons per condition) and, nearly uniformly, did not rescue nuclei size in neurons (one‐way ANOVA, F
3,221 = 26.04, P < 0.0001; Dunnett’s multiple comparisons test vs. KO untreated: control, ***P < 0.0001 and Z = 6.37; Nefiracetam, P = 0.91 and Z = 0.39; PHA 543613, P = 0.19 and Z = 1.74; WT83/Q83X and WT82/K82fs cell lines; N = 45 nuclei per condition), neurospheres (one‐way ANOVA, F
5,264 = 5.579, P < 0.0001; Dunnett’s multiple comparisons test vs. CTR/KO untreated: control, ***P < 0.0001 and Z = 3.782; KO untreated, P = 0.51 and Z = 1.066; Nefiracetam, P = 0.23 and Z = 1.35; PHA 543613, P = 0.99 and Z = 0.05; Nefi + PHA, P = 0.24 and Z = 1.012; WT83/Q83X cell lines; N = 45 nuclei per condition), or cortical organoids (one‐way ANOVA, F
3,281 = 6.594, P = 0.0003; Dunnett’s multiple comparisons test vs. KO untreated: control, **P = 0.009 and Z = 2.38; Nefiracetam, **P = 0.01 and Z = 3.05; PHA 543613, P = 0.98 and Z = 0.30; WT83/Q83X and WT82/K82fs cell lines; N = 45‐90 nuclei per condition). Spine density was rescued or partially rescued by the compounds (one‐way ANOVA, F
3,63 = 8.449, P < 0.0001; Dunnett’s multiple comparisons test vs. KO untreated: control, ***P < 0.0001 and Z = 4.35; Nefiracetam, P = 0.16 and Z = 2.01; PHA 543613, ***P = 0.001 and Z = 3.24; WT83/Q83X and WT82/K82fs cell lines; N = 11–28 neurons per condition). Note that statistical comparisons are presented relative to KO untreated or, for mosaic neurospheres, CTR/KO untreated. Data information: Data are presented as mean ± s.e.m.

