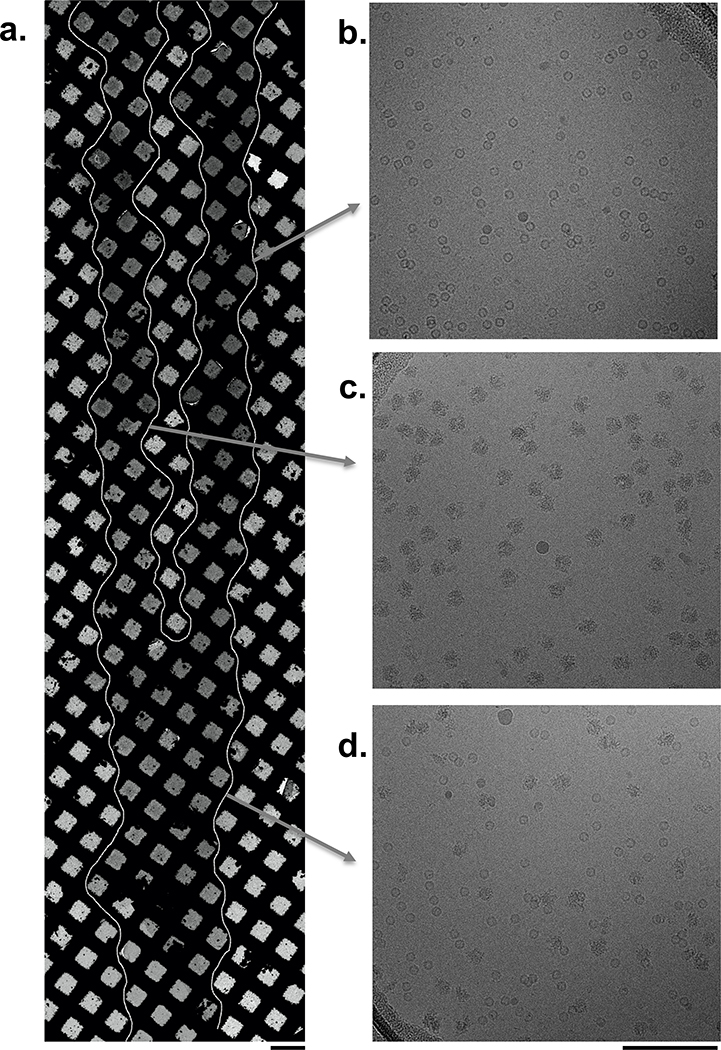
Figure 1: Apoferritin and 70S ribosomes were used as a proof of principle to illustrate mixing on the nanowire grids.
(a) Overview of the vitrified grid showing the sample streams merged at the leading edge (bottom) and separated at the trailing edge (top). Squares containing vitrified ice are indicated by a white outline. Scale bar, 100 μm. Micrographs obtained from the indicated regions show either only (b) apoferritin or (c) 70S ribosomes or (d) a mix of both samples and are representative of approximately 470 images each. Scale bar, 100 nm.

