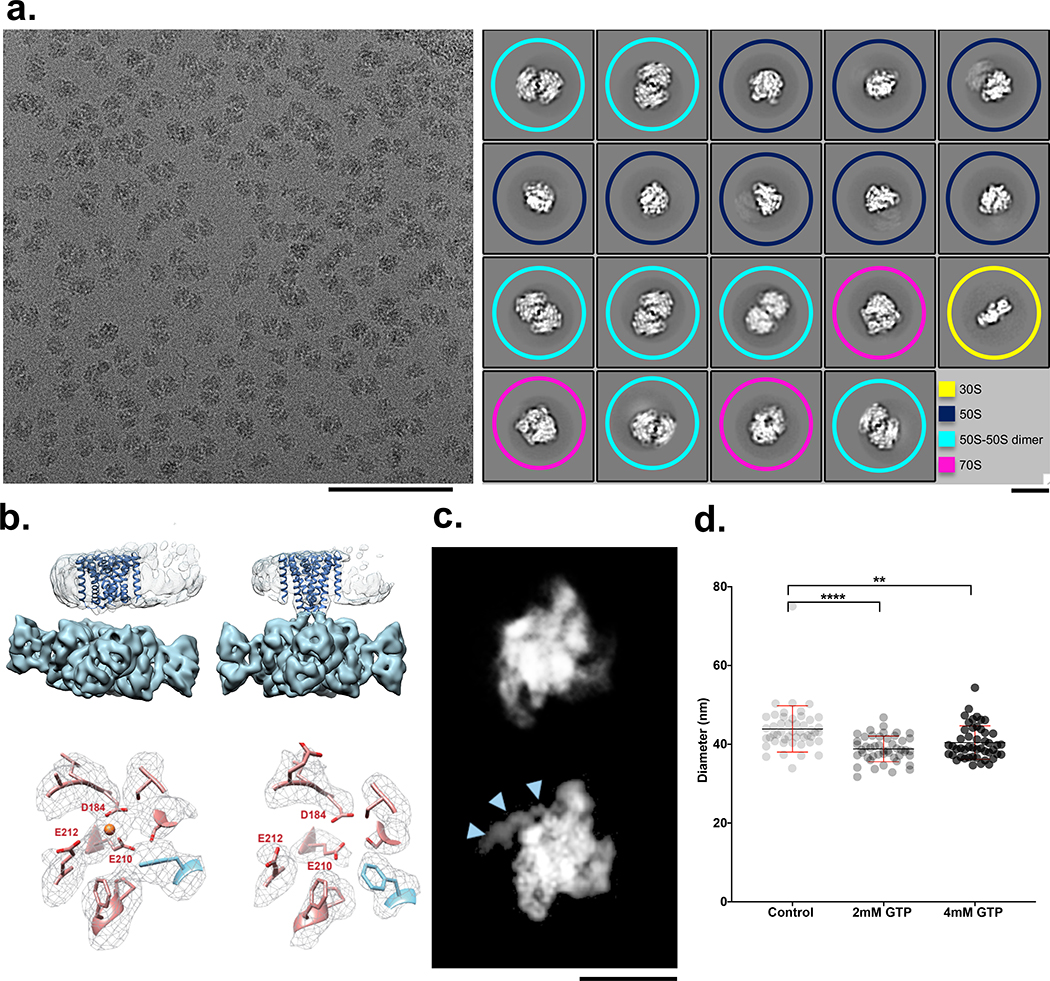
Figure 2: Four examples of biological systems where time-resolved cryoEM provides answers.
(a) left: Micrograph from the mixed region of a Spotiton prepared grid shows 30S and 50S ribosomal subunits and 70S complexes and is representative of 311 images. Scale bar, 100 nm; right: corresponding 2D classes show particles representing a population of 30S (yellow), 50S (blue), 50S-50S dimers (turquoise), and 70S (magenta). ~20% of particles were reconstructed to a 70S complex at a resolution of 4.75 Å (see Methods and Extended Data Fig. 2). Scale bar, 20nm. (b) 3D volumes generated from MthK in the presence (top left) or absence (top right) of calcium showing clear differences in the overall conformation of the channel. The bottom row shows one of the three Ca2+ binding sites in MthK either occupied in the case of a mixing experiment (left) or vacant as with the MthK only control (right). (c) Representative class averages of RNAP alone (top) or mixed with promoter DNA (bottom) showing DNA clearly bound (blue arrowheads). Scale bar, 10nm. (d) Measured diameters (mean ± SD) of dynamin-decorated tubes without (Control: 43.85, ± 5.86, n=48) and with GTP (2 mM: 38.80, ± 3.2, n=48; 4 mM: 40.40, ± 4.23, n=48,). **P = 0.0014, ****P = 0.0001, two-sided Student’s t test.

