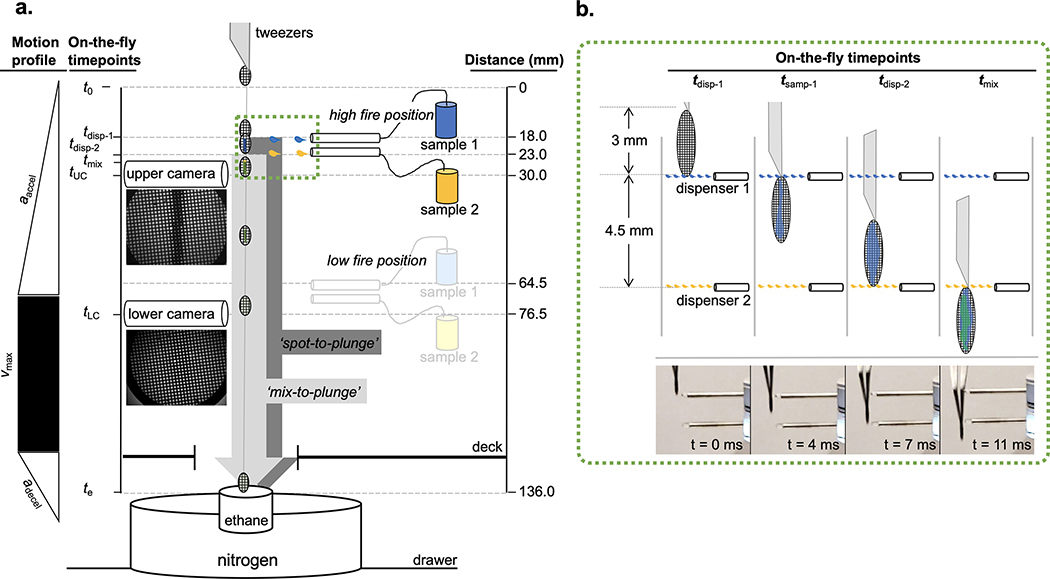
Extended Data Fig. 1.
Specifications of time-resolved Spotiton operation
(a) Diagrammatic overview of the distances (fixed) and elapsed times (variable) relevant to spraying and mixing two samples on a moving grid. Simultaneous dispensing of both samples is triggered after the grid plunge begins. Representative images from the upper and lower cameras are shown directly below the illustrations of each. Sample 1 and sample 2 are indicated in blue and yellow, respectively. (b) Magnified view of (green-dashed) boxed area in (a) showing grid and dispensing at specific time-points with corresponding high-speed video captures of the tips and grid below. Elapsed times shown on each image reflect estimates from a video of a grid plunged under Condition 2 (Supplementary Table 1). Objects in (a) and (b) are not drawn to scale. Supplementary Tables 1–4 list values for the following parameters of a grid plunged as depicted in (a) and (b): aaccel, acceleration rate; adecel, deceleration rate; vmax, maximum velocity; t0, plunge start point; tdisp-1, grid leading edge reaches first dispenser; tsamp-1, sample 1 fully applied to grid; tdisp-2, grid leading edge reaches second dispenser; tmix, samples 1 and 2 fully applied to grid; tUC, grid reaches upper camera, tLC, grid reaches lower camera; te, grid plunges into ethane. ‘Spot-to-plunge’ and ‘mix-to-plunge’ in (a) reflect the elapsed times from tdisp-1 or tmix to te, respectively.

