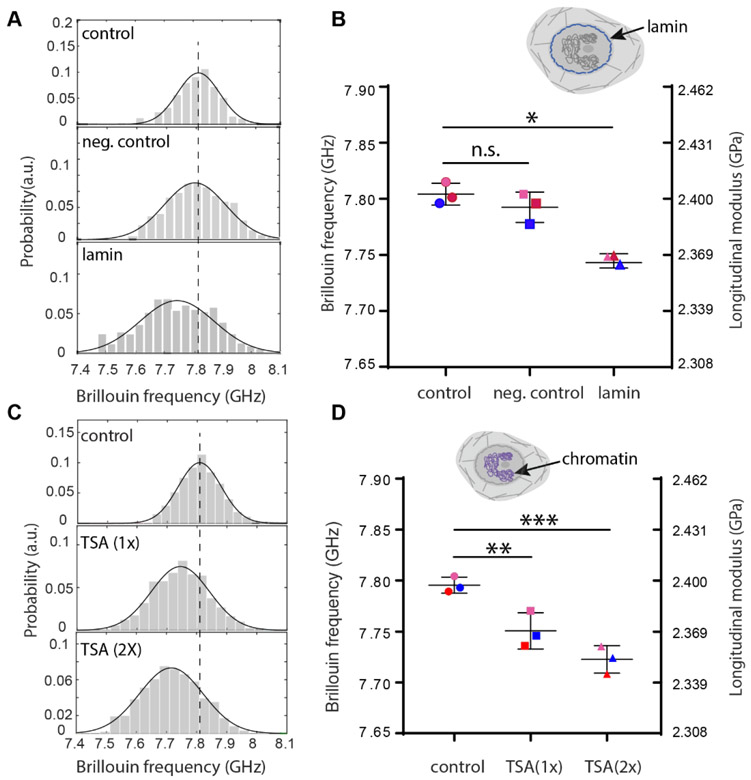
Figure 2. Regulation of intact nuclear modulus of suspended cells by epigenetic factors.
(A) Representative flow results of cellular nucleus from control (n=122), negative control (n=195) and knockdown (n=114) groups, respectively after lamin A/C knockdown. Histograms represent measured data and solid curves are fitted results. The dotted line indicates the peak location of the control group. (B) Averaged Brillouin shifts of three repeated groups. Data points show the mean of all independent repeats (n=69, 114, 162 for the second repeat and n=149, 198, 305 for the third repeat, respectively); the bars show the standard deviation. The color of the dots represents different repeated groups. n.s.: not statistically significant. Inset cartoon highlights the structure of lamin in the cell model. (C) Representative flow results of cellular nucleus from control (n=171), 1-unit-dose treatment (n=439) and 2-unit-dose treatment (n=84) groups after chromatin decondensation with trichostatin A (TSA). (D) Averaged Brillouin shifts of three repeated groups (n=117, 319, 220 for the second repeat and n=161, 245, 301 for the third repeat, respectively). Inset cartoon highlights the structure of chromatin in the cell model. *p<0.01. **p<0.02, ***p<0.003. Statistical significance is determined by performing paired t-test with all repeats.

