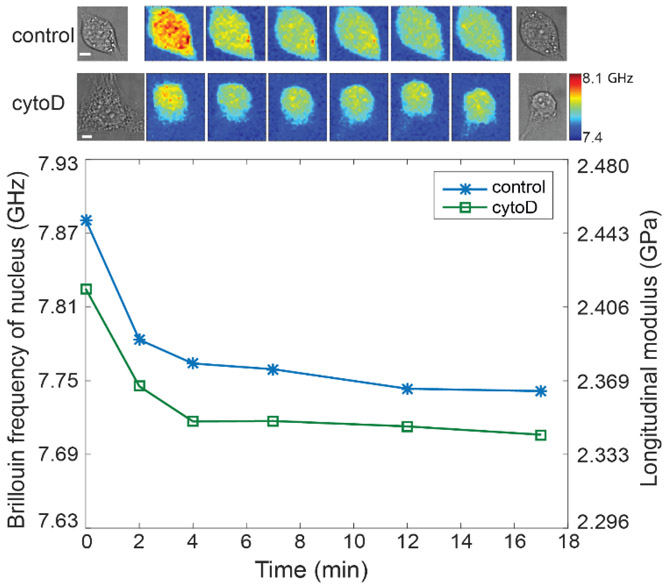
Figure 5. Changes of the nuclear modulus of the representative attached 3T3 cells during detachment with trypsin.
The images in the first and second rows on top show the representative cells from control and CytoD-treated groups, respectively. The scale bar is 5 μm, and the color bar has a unit of GHz. The markers indicated the averaged Brillouin shift of the nucleus corresponding to each Brillouin image, and the lines are guides of eye.

