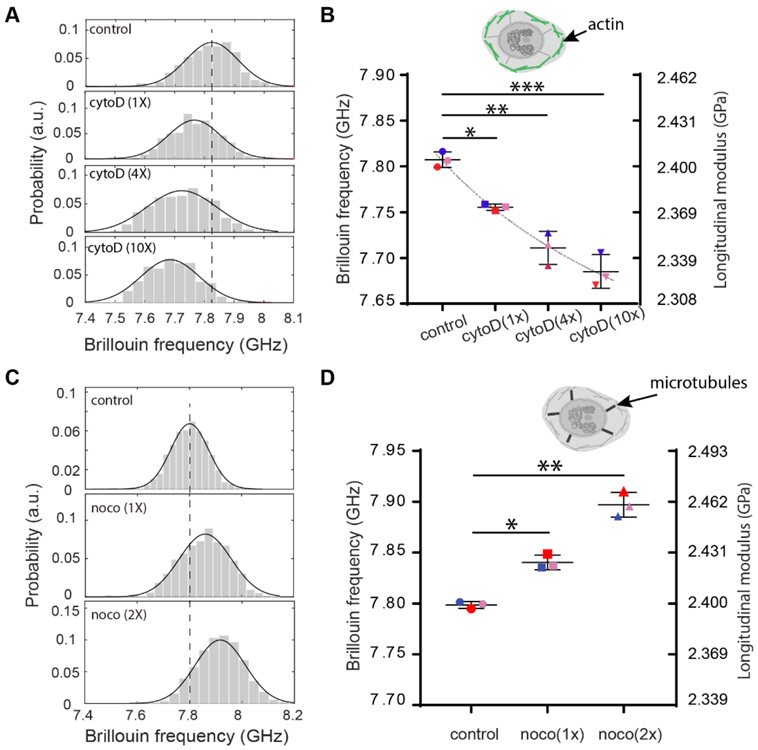
Figure 6. Regulation of intact nuclear moduli of suspended cells by cytoskeletal modification.
(A) Representative results of cellular nucleus from control (577), 1-unit-dose treatment (n=98), 4-unit-dose treatment (n=279) and 10-unit-dose treatment (n=368) groups after CytoD treatment. Histograms represent measured data and solid curves are fitted results. The dotted line indicates the peak location of the control group. (B) The averaged Brillouin shifts of three repeated groups (n=132, 365, 115, 220 for the second repeat and n=119, 204, 127, 61 for the third repeat, respectively). Data points show the mean of all independent repeats, and the bars show the standard deviation. The colors represent different repeated groups. The dotted line indicates the trend of the decrease. Inset cartoon highlights the structure of cytoskeleton in the cell model. (C) Representative results of cellular nucleus from control (n=349), 1-unit-dose treatment (n=255) and 2-unit-dose treatment (n=371) groups after Nocodazole treatment. (D) The averaged Brillouin shifts of three repeated groups(n=81, 258, 247 for the second repeat and n=390, 106, 172 for the third repeat, respectively). Inset cartoon highlights the structure of microtubules in the cell model. *p<0.02, **p<0.01, and ***p<0.003. Statistical significance is determined by performing paired t-test with all repeats.

