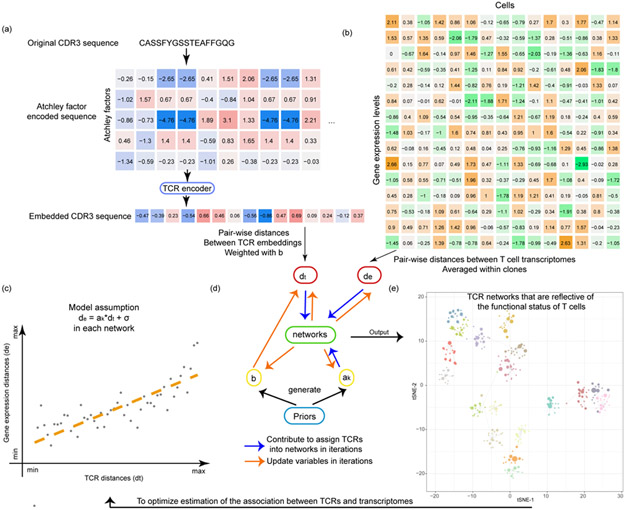
Fig. 1.
The tessa algorithm. (a) A flowchart shows how the TCR sequences are encoded into numeric vectors that are amenable for mathematical operations. (b) A heatmap indicating the scRNA-Seq expression matrix, which was used to calculate the expression distances, and serves as another input into the tessa model. (c) The core rationale of tessa: to combine the information from TCR and RNA expression. (d) The two key processes of the tessa model to combine the information iteratively: updating variables to maximize the association in (c) and updating TCR network assignments according to the updated variables. (e) A t-SNE plot intuitively shows tessa-identified networks of TCRs, which has incorporated expression information, and can help achieve more refined estimation of the association in (c) within each network.

