Fig. 2.
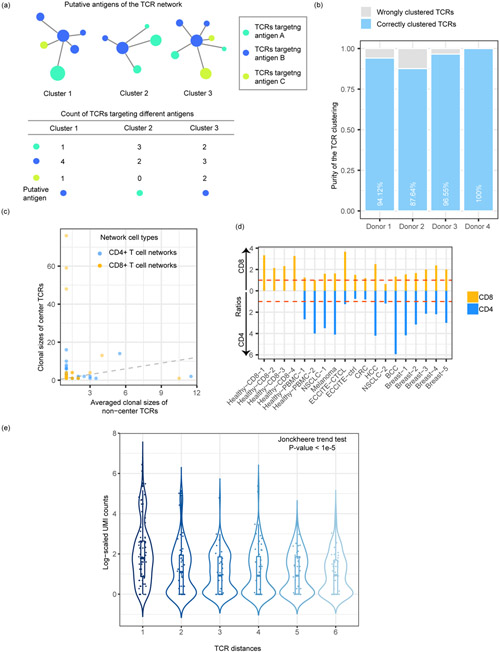
TCR networks demonstrate a gradient of targeting efficiency. (a) The calculation of TCR network purity. (b) Clustering purities in the four 10X Healthy-CD8 datasets. Unexpanded clones with only one T cell and networks with only one clone were excluded. The numbers of unique TCRs were 119, 364, 87 and 62, respectively. (c) One typical example (Breast-5) to show the clonal sizes of center TCRs and the median clonal sizes of non-centered TCRs for each network. The dashed line represents the X=Y line. 79 CD8+ and 150 CD4+ TCR networks with at least three clones were included. (d) Ratios representing central clones’ expansion levels of the CD8/CD4 clones in each dataset. (e) The decreasing gradient of antigen binding strength for TCRs, along with increasing dissimilarity to the center TCRs. The TCR clonotypes from each dataset were divided into six groups of equal size (N=198). Unexpanded clones with only one T cell and networks with only one clone were excluded.

