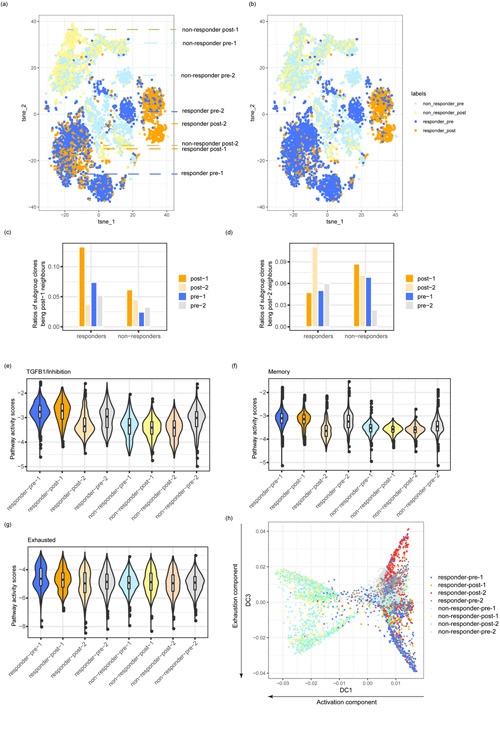
Fig. 3.
TCR similarity determines fate of T cells post-immunotherapy treatment. (a,b) T-SNE plots of the post-treatment and pre-treatment cells from all the BCC patients (dataset BCC, Supplementary Table 1). The colors represent either clonal level labels (a) or network level labels (b). TCR networks were built separately for cells from each patient. The post-1, post-2, pre-1 and pre-2 subgroups were described in the result section. (c,d) The ratios of clones of the neighbors of post-1 (c) and post-2 (d) in each subgroup. (e-g) Pathway activity scores including TGFB1/inhibition gene pathway (e), memory gene pathway (f), and exhausted gene pathway (g) of the different cell subgroups. (h) Diffusion map analysis showing the cell subgroup distribution along the activation diffusion component and the exhaustion diffusion component. The numbers of T cells in the eight subgroups analyzed in Fig. 3 were: responders: N(post-1) =389, N(post-2) =841, N(pre-1) =1321, N(pre-2) =787; non-responders: N(post-1) =550, N(post-2) =757, N(pre-1) =892, N(pre-2) =670.

