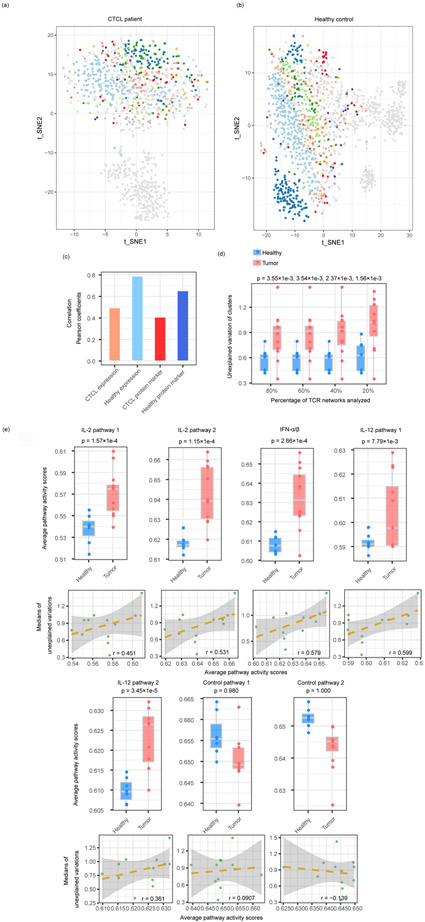
Fig. 4.
CD8+ T cells are functionally constrained by TCRs differently in healthy donors and tumor patients. (a,b) t-SNE plots of the T cells from a CTCL patient (a) and a healthy donor (b). Cells in each of the top 10 largest clones were labeled in non-grey colors, and the other cells were labeled in grey. The total numbers of cells were 1,103 for (a) and 1,462 for (b). (c) Correlation between the TCR distances and the RNA/protein expression distances of CTCL and healthy donor T cells datasets. (d) The boxplots show the unexplained variance of TCR networks from the twelve tumor samples of different cancer types and the seven healthy samples combined (Supplementary Table 1). X-axis indicates the percentages of TCR networks analyzed with cutoffs. The P values were generated from one-sided Student’s T-tests. (e) Differences between the pathway activities calculated from the different cancer and healthy datasets, as in (d) (upper panel) and the correlation between average pathway activity scores and medians of unexplained gene expression variances by TCR in all tumor datasets (lower panel) (Supplementary Table 1). The P values were generated from one-sided Student’s T-tests. The shaded areas denote the 95% confidence intervals for linear regressions.

