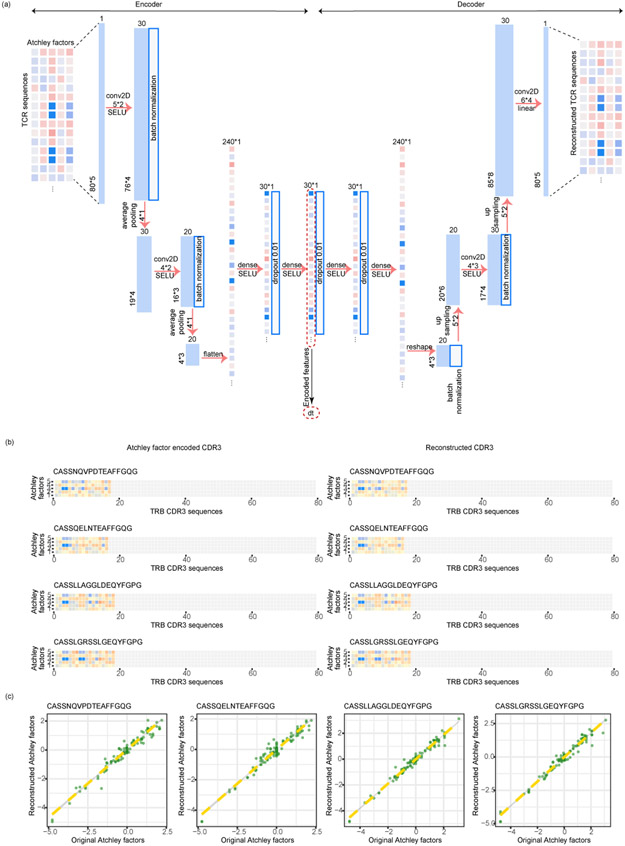
Extended Data Fig. 1.
Details of the stacked auto-encoder for TCR embedding. (a) The structure of the auto-encoder, with the configurations of each layer shown. (b) Typical examples of TCR CDR3b sequences, heatmaps of the initially embedded ‘Atchley’ matrices of TCRs, and heatmaps of the auto-encoder-reconstructed ‘Athley’ matrices. The TCR sequence examples were not used in the training step of the auto-encoder. (c) Scatterplots showing the consistency between the ‘Atchley factor’ values of the original and re-constructed TCRs. Green points represent tiles in the heatmaps in (b).

