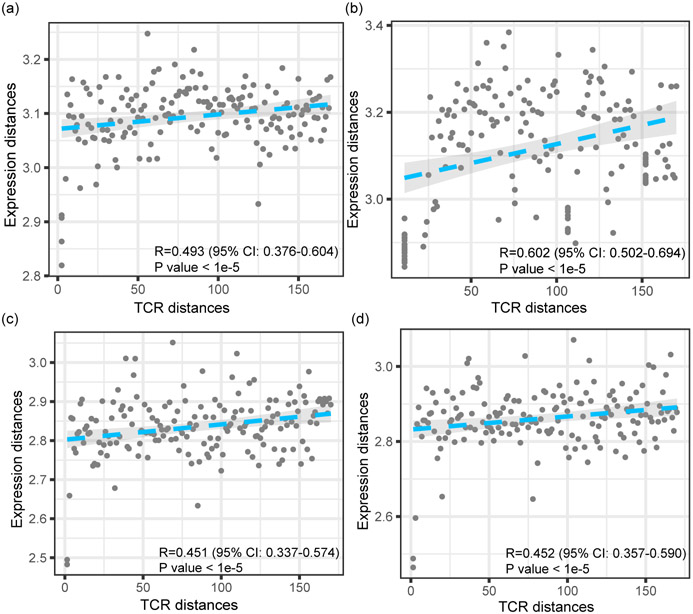
Extended Data Fig. 2.
Scatterplots showing the relationships between the distances of TCRs and the distances of RNA expression levels for several more datasets. Both distances are calculated in a pair-wise manner between all the T cell clonotypes of each dataset. Four example datasets are shown: Healthy-CD8-3 (a), Healthy-CD8-4 (b), Breast-1 (c), and Breast-2 (d) (Supplementary Table 1). The P values indicate the significance of the Pearson correlation coefficients. The shaded areas denote the 95% confidence intervals for linear regressions.

